
Here are the latest updates to our ResTech platform. Please scroll down to see previous weeks’ release notes.
April 2, 2026 (Catch Up)
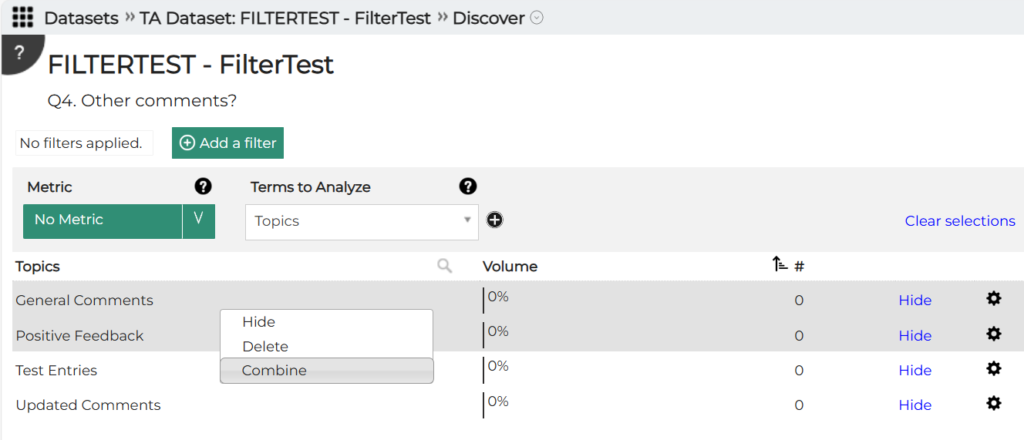
AI Analytics for Text
- Fixed bug in topic modeler that would skip some records
- Fixed issue in comparison tool
- Improved exporting of comparisons
- Updated to latest AI model for topic modeling
Research Cloud
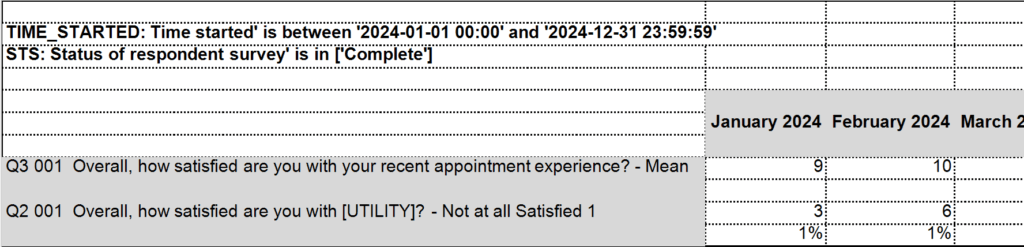
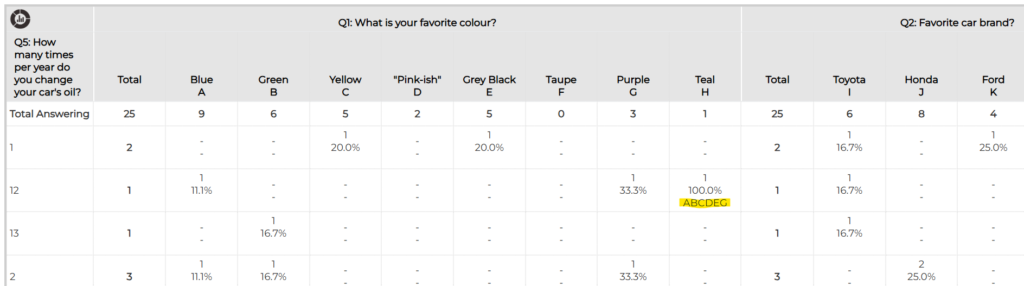
- Crosstab enhancement – composite scores
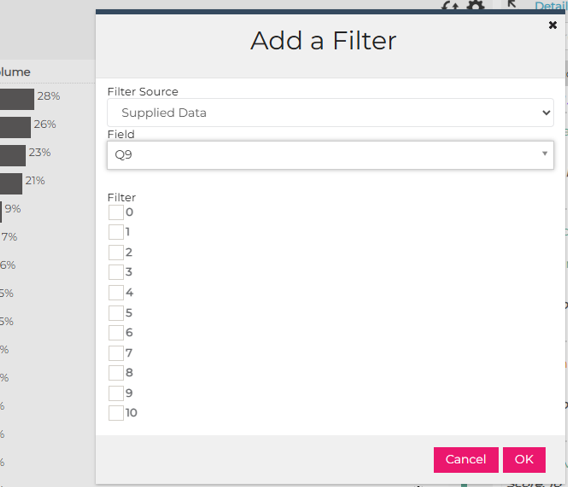
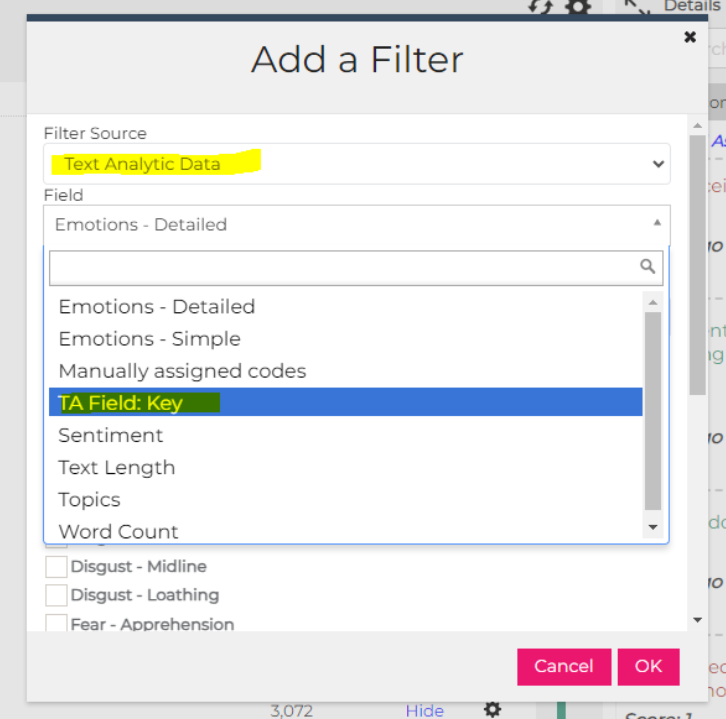
- Filter “enhancement” – the order of field values was “optimized” for most surveys so that the original order from the survey, or a logical representation, is maintained
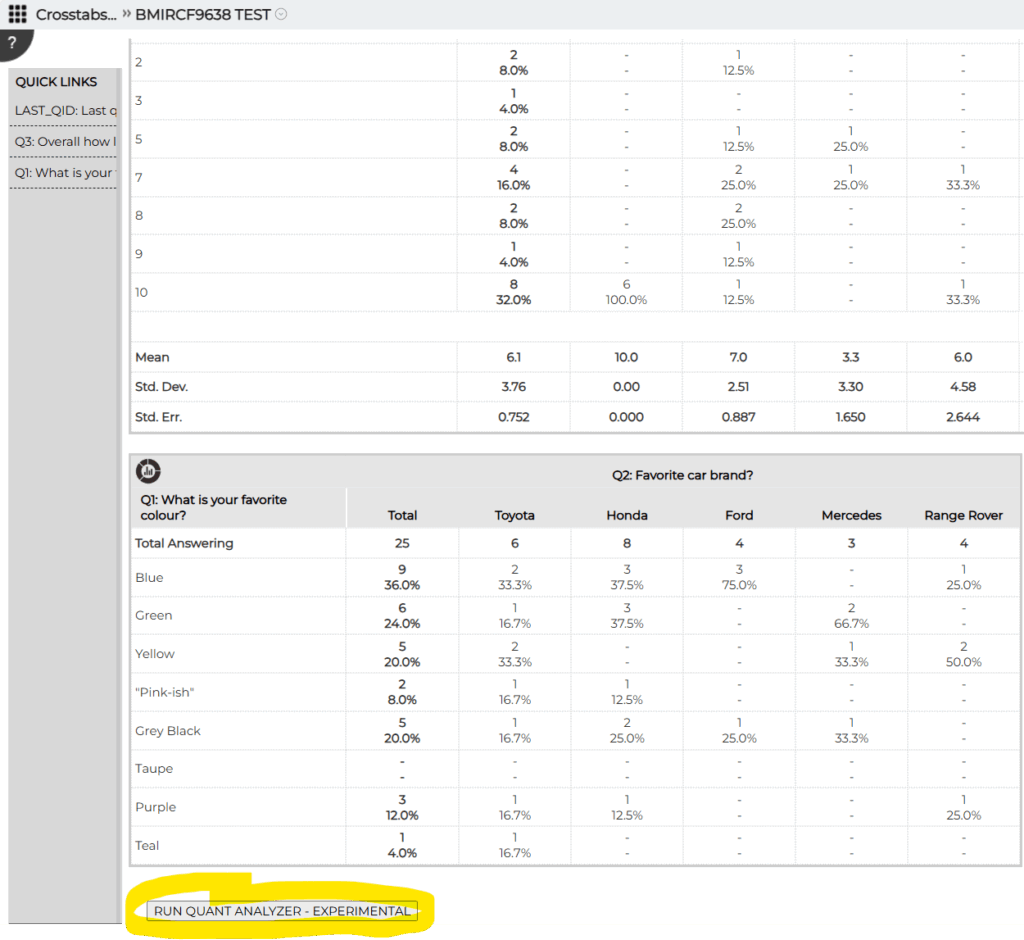
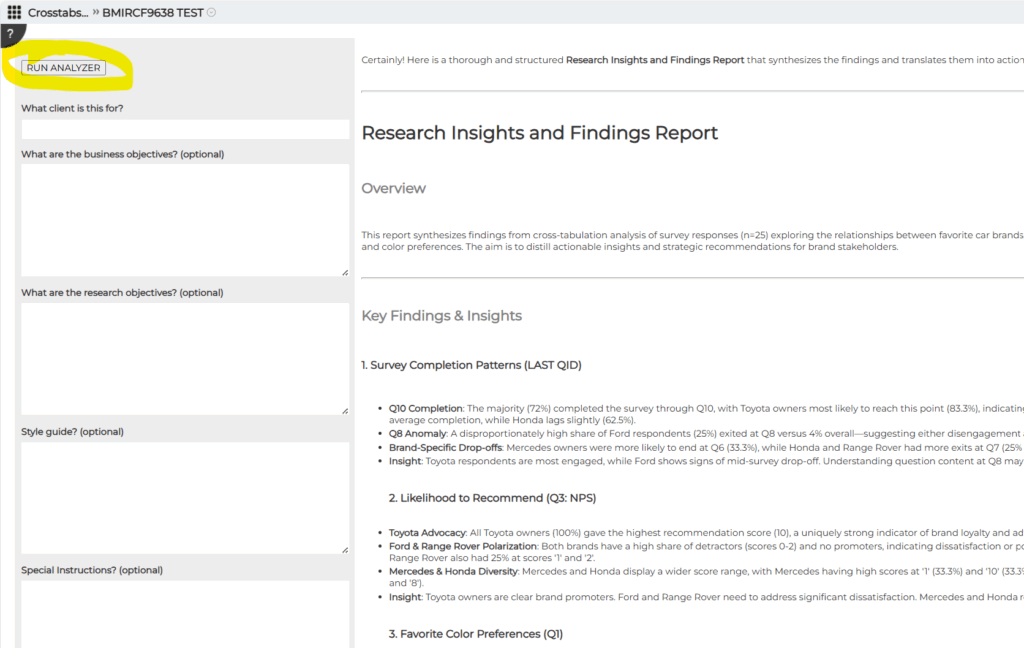
- Quant analyzer in crosstabs (still Bellomy only) has been enhanced with anti-hallucination technology and display format improved
- Fixed issue with summary widgets in dashboards
- Crosstab export label changes
- Crosstab export fixes
- Fixes to AI interviews handling of data flow
- Case management now supports new editable fields in focus view
Visual Lab
- Support for folders was added
- A MY IMAGES left side-bar is now present when creating images
- AI REVIEW occurs automatically when generating images and flags spelling issues, duplication issues, and other suggestions
- A few small UI cleanups
January 15, 2026 (Catch Up)
AI Analytics for Text
- Fixed bug in exporting comparisons report when topics/labels contained commas
- AIA upgraded to use GPT5.1 for topic modeling, ask bell, ask the AI
- Change to timing of survey loaded notification emails
Research Cloud
- Improved site load performance, module load performance
- Reduced “unknown object” errors
- Fixed a bug in insight object sharing that would sometimes NOT show objects to users even when shared with them
- Change to how projects are made available to individual research clouds
Qual Analyzer
- Fixed an issue with “include individual outputs” feature
December 4, 2025 (Catch Up)
Case management:
- Resolution values can now be configured on a system by system basis
Crosstabs:
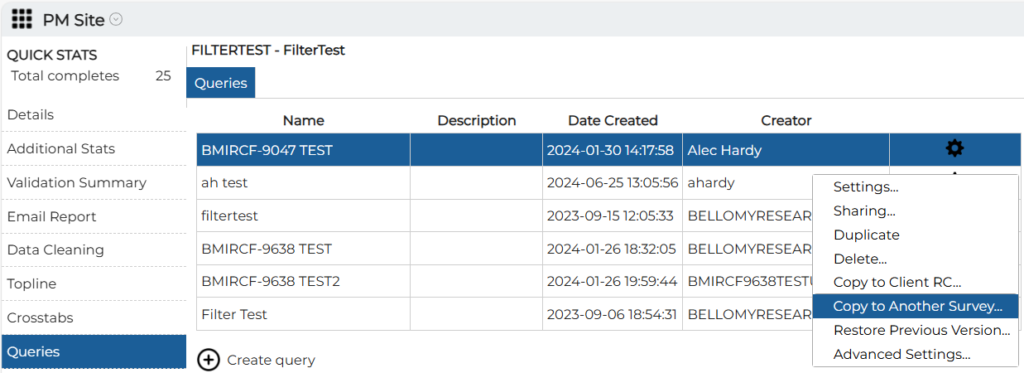
- Developer tools now allows access to details enabling copying crosstabs across RCs when needed. (And other use cases.)
Dashboards:
- Developer tools now allows access to details enabling copying dashboards across RCs when needed (And other use cases.)
AI Analytics for Text
- Bulk tools, topic modeler, sub-topic modeler, recommendation modeler now all use the latest GPT-5-mini AI for bulk operations. This improves quality of AI inference on those tasks.
PM Site
- Verbatim Cleaner – Corrected an issue with CSV export that occasionally caused output file to be malformed
Overarching Changes
- Legacy survey datasets when used for crosstabs, dashboards, queries, media galleries and others will now properly encode non-English characters stored in legacy survey encoding (e.g. Aéropostale)
Bug fixes
- Crosstab related bug fixes applied
- Segmentation microsite bugs related to image handling corrected
October 30, 2025 (Catch Up)
Note: A few releases were skipped and one release note was not shared for a prior release. This is catching is up.
Crosstabs Improvements
- Option to not cross-test (stat test) nested columns
- Quant analyzer button now appears at top of results for easier access
AI Analytics
- Fixed a bug in opening datasets that incorrectly reported a dataset was not available
- Fixed a bug in bulk tools to update correct filtered results
- Comparison tool now offers save and reloading of comparison groups
- Enhanced exporting of word frequency lists
Case Management
- Added a user lookup field type to focus views
- Added a survey record viewer type to focus views
Other
- Field designer (Crosstabs, Queries, Dashboard, Etc.) now allows for reordering fields
- Field designer now auto-focuses on proper net field when adding new nets
- Qual analyzer export enhancements
- AI moderated interviews internal changes
September 11, 2025 (Catch Up)
Note: A few releases were skipped and one release note was not shared for a prior release. This is catching is up.
Added quarterly level date aggregation support to AIA Data Source
Prior to this, if a user asked for quarterly trending in crosstabs/dashboards while using an AIA data source (not a survey), they would receive an error.
One click access to AskBell from within the BellomyRC is now enabled – no need to login to AskBell separately.
Case management enhanced to support user-value field type
Case management now supports a display as/field type of ‘user’ that allows end users of the tool to pick a case management user for a field in the data record, not just the standard assignee.
AskBell enhanced with “Multitool Expert”
The multitool expert is easy to underestimate. The unassuming expert replicates much of what ChatGPT-5 can do enabling AskBell to produce a range of file types such as Excel files, PPT decks and more. There is more here to share that requires its own share out.
July 31, 2025
AskBell can be accessed via BellomyRC without logging in again
One click access to AskBell from within the BellomyRC is now enabled – no need to login to AskBell separately.
Query and Dashboard tools – Field list search is locked to top
In design mode for queries and dashboards, the field search box is now fixed at the top and does not scroll off-screen.
Crosstabs – Stat Test Letters can be emphasized for easier visibility
From the options tab, choose “Emphasize stat testing letters (bold & orange)
Query Tool – Users can set the width of all columns at once
Within the query tool design view, setting column options on any column now provides a “Set this width for all columns” checkbox.
Query Tool – Grid area does not auto-scroll left with column changes
User convenience improvement – when adding columns add adjusting column headings, the grid does not auto-scroll far left.
Resolved Issues
The following issues were resolved with exports from Dashboards:
- Crosstabs – Multi-choice question columns no longer disappear based on whether or not data is present
July 24, 2025
PM Site Users can Customize Settings for Verbatim Cleaner
Filters can be applied, the prompt modified and a test mode is available
AskBell – Users can pin the left pane to open/closed state
In AskBell, users can choose to leave the left bar open/closed and it retains that setting across sessions
Crosstabs – Save As Copy Improvements
Users now have an opportunity to name the newly saved crosstab at save time.
AIA – Users can now Save Filters
Within AI Analytics for Text, users can save filters and reload them across sessions. Filters are shared across all users for a dataset.
Resolved Issues
The following issues were resolved with exports from Dashboards:
- AIA – Topic modeler did not correctly assign topics when topics had extraneous name characteristics
- AIA – Chat feature now properly associates chat with selected question and does not span chats across questions
- Crosstabs – Shading of Excel export rows fixed
- Dashboards – Exporting would sometimes show an error and then succeed. This has been corrected.
- Crosstabs – Rows/columns already selected in saved crosstab now longer appear in available rows/columns
July 18, 2025
Read AI Output as AI is Writing
In AskBell, users can now scroll back through past messages while the AI is writing output.
Enter key/Shift-Enter Usage Guidance
AskBell now provides some written, on-screen, guidance on using shift-enter for multi-line messages.
Resolved Issues
The following issues were resolved with exports from Dashboards:
- Fixed an issue in AskBell handling CSV files
- Qual analyzer no longer outputs unexpected characters in output
July 11, 2025
Visually Differentiate Goals and Ratings
Dashboard widgets enhanced so that goals and other elements can be bolded using configuration.
PM Site – AI Auto Cleaning of Verbatims
The PM site data cleaning tools now includes a tool for cleaning verbatims. Initial release for review and refinement with collaboration.
Resolved Issues
The following issues were resolved with exports from Dashboards:
- Configure fields using AI – sometimes for certain surveys, it would be impossible to manually configure some fields after using AI to configure them. This issue is resolved.
June 26, 2025
Ask Bell
The initial release of Ask Bell is being rolled out. Watch your email for details about logging in and other info.
Resolved Issues
The following issues were resolved with exports from Dashboards:
- Dashboards whose tile size were changed resulting in tiles that were out of bounds were causing blank/empty tabs in exports. Now, when a dashboard’s Tile Size is increased to Medium, Large, or X-Large, the user is given a warning message.
- Issues with Summary Table exports were addressed.
- Blank exports from Dashboards that contain Summary Bar Charts were fixed.
June 12, 2025
Highlights
AI Analytics – Add Standard Topics During Topic Modeling
AI Analytics – Self-Service Dataset Duplication for Bellomy Users
AI Analytics – Self-Service Dataset De-Duplication for Bellomy Users
AI Analytics – Automated Dataset De-Duplication
AI Analytics – Undelete Topics
AI Analytics – Creator Info on Dataset Cards
PM Site – Filter by Email Domain on Email Trends Report
PM Site – Scheduled Email Jobs Turned Off for Closed Studies
Crosstabs – Improved Description for Custom and Summary Tables
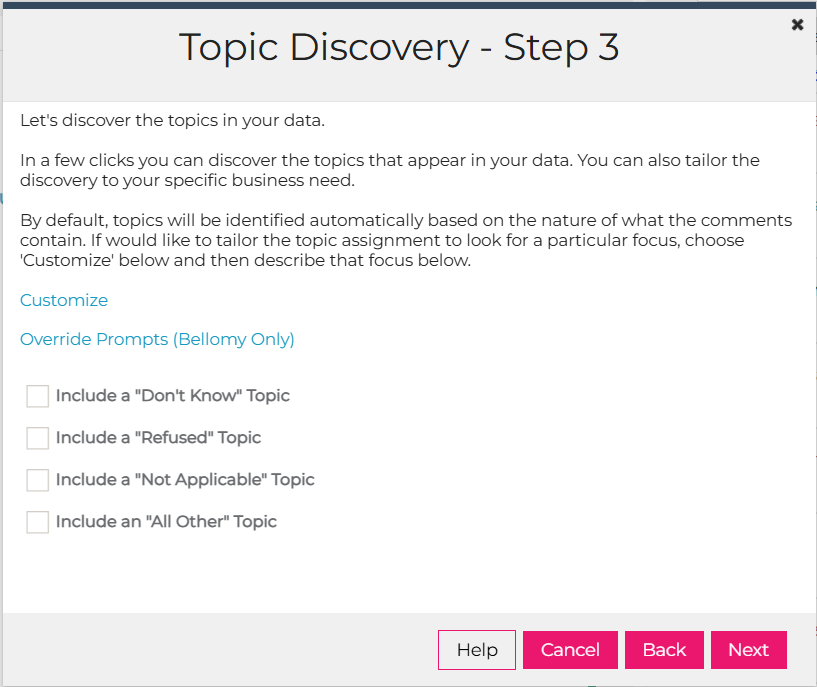
AI Analytics – Add Standard Topics During Topic Modeling
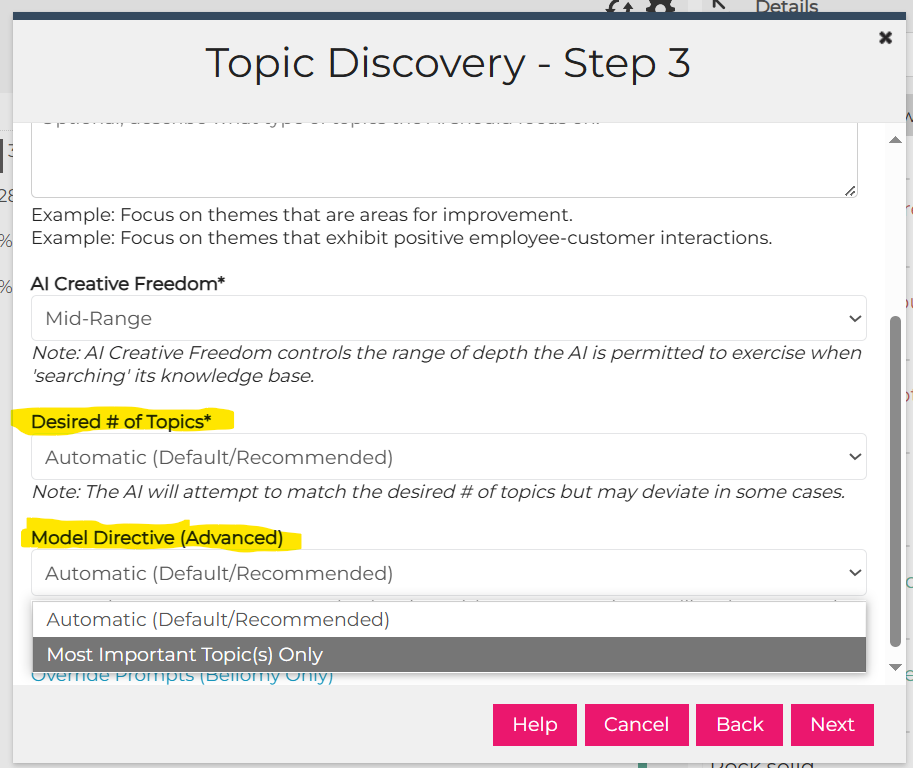
Standard topics such as “Don’t Know,” “Refused,” and “Not Applicable” can now be easily created during the topic modeling process. This feature is available in Step 3 of the AIA topic discovery process and helps streamline the categorization of common response types.
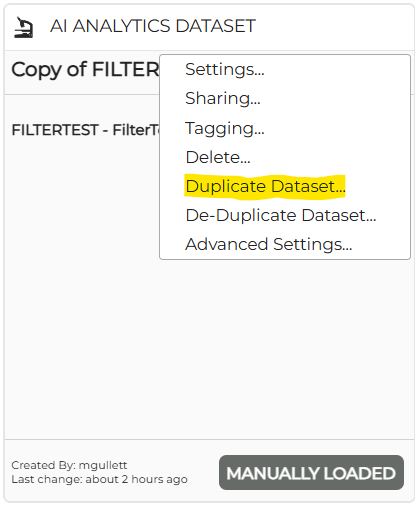
AI Analytics – Self-Service Dataset Duplication for Bellomy Users
Bellomy staff can now duplicate AIA datasets. Simply click the gear icon on an AIA dataset and select the “Duplicate Dataset” option. You’ll receive an email notification when the process is complete. Duplication of large datasets may take some time.
Also note that any changes made to the original dataset while the copy is in progress may or may not make it into the copy.
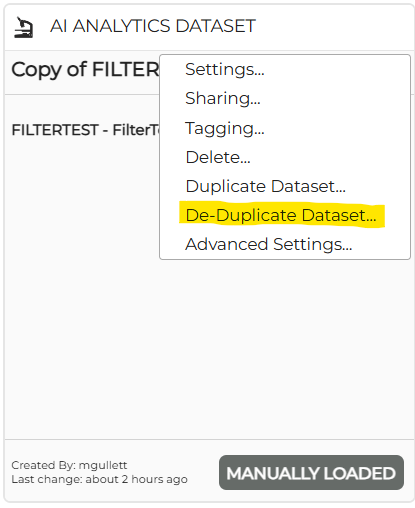
AI Analytics – Self-Service Dataset De-duplication for Bellomy Users
To address record duplication concerns, Bellomy users can now select “Deduplicate dataset” from the gear icon on an AIA dataset. You can select which fields uniquely identify records, and the system will remove duplicates while keeping the first occurrence. An email notification will be sent once the process completes.
Please note that the columns chosen to identify each record should be chosen carefully since duplicates that are removed cannot be recovered back into the dataset.
AI Analytics – Automated Dataset De-duplication
The DevOps team can now automate the dataset de-duplication process.
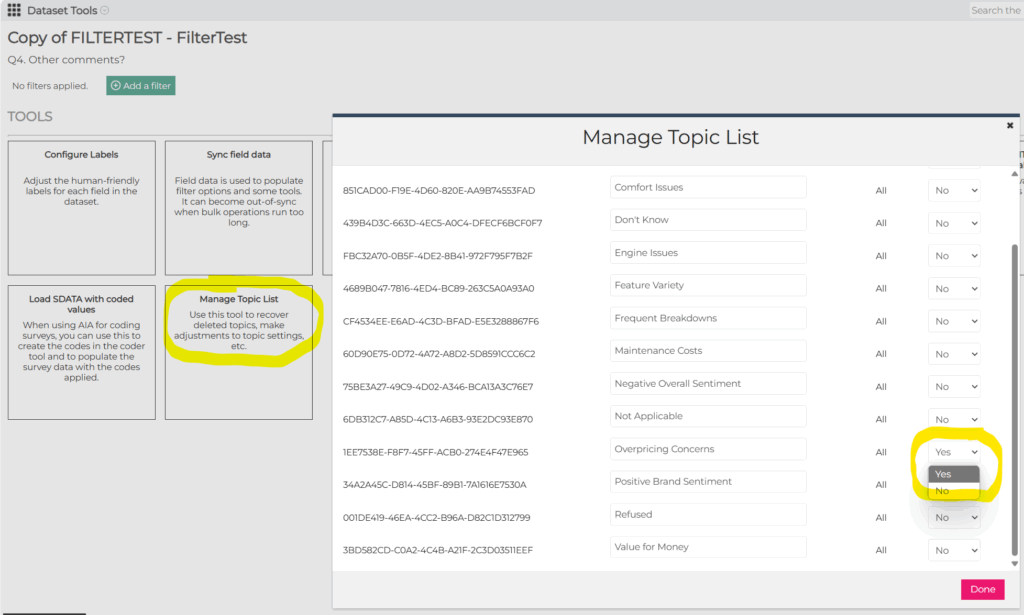
AI Analytics – Undelete Topics
Users can now restore accidentally deleted custom topics in AIA datasets through the user interface. This self-service feature eliminates the need for staff intervention when topics are mistakenly removed. This is available via the Manage Topic List dataset tool.
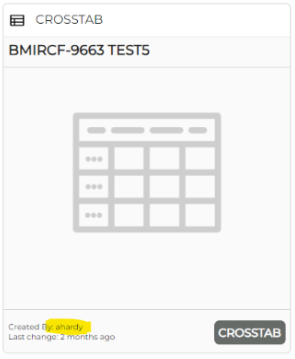
AI Analytics – Creator Information on Dataset Cards
AI Analytics dataset cards now displays the name of the user who created the dataset, similar to Crosstabs, Query, and Dashboard cards. This helps identify who can share a dataset with others.
PM Site – Filter by Email Domain on Email Trends Report
The Email Trends Report now allows filtering by recipient email domain (Gmail, Yahoo, etc.). This enhancement helps track email performance across different email providers and identify potential delivery issues.
PM Site – Scheduled Email Jobs Turned Off for Closed Studies
When a study is closed, email scheduling is now automatically turned off for manual email jobs through the PM site. This prevents accidental emails from being sent for closed studies.
Crosstabs – Improved Description for Custom and Summary Tables
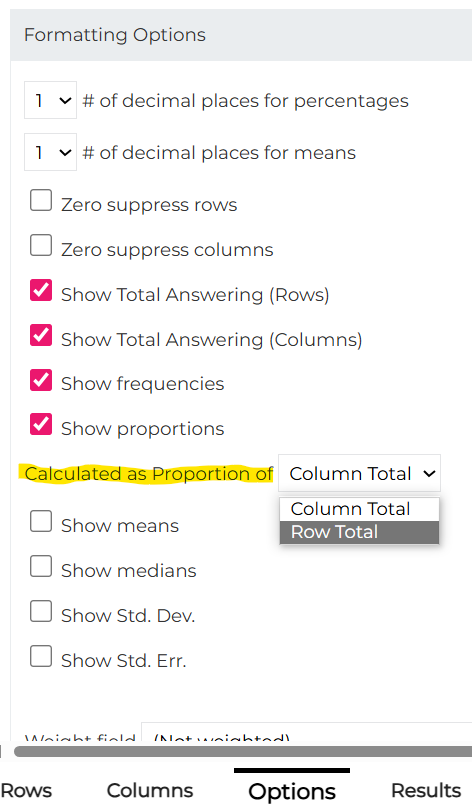
The descriptions displayed when creating new Custom Tables and Summary Tables have been enhanced to better clarify the differences between these options. Custom Tables use one common Total Answering (denominator) across all rows, while Summary Tables calculate each row based on its own Total Answering (row-level denominator).
Filter Items Now Sorted
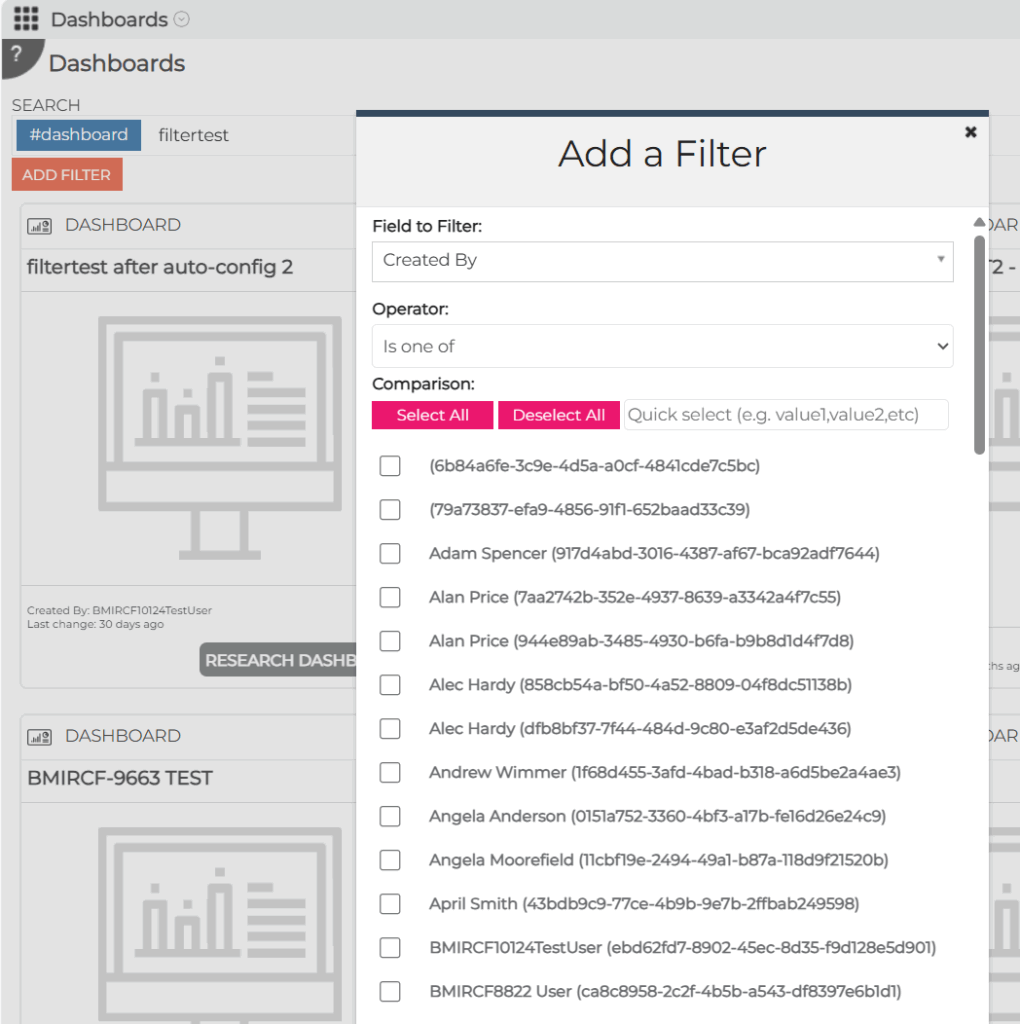
When adding a filter to a Dashboard, Crosstab, Query, or elsewhere in the RC, the items listed in the filtering popup are now listed in order (alphabetical, numeric date, etc). For example, the “Created By” filtering options are now sorted alphabetically, making it easier to locate specific creators when filtering Insights Objects.
Resolved Issues
The following issues were resolved:
- In AI Analytics, the text viewer (right pane) color coding now persists when removing and adding back fields
- Fixed an issue with Quant Analyzer where Phase 3 & 4 would remain in “Stand by” status
- Fixed issue in DIY Surveys so that the Tools & Files sub-tab is available for Decommissioned surveys
- On the PM Site, the Rerun Analysis button is now consistently visible on the Speeding/Survey Length Tab
- Improved ways that AI Interviews Moderator desired behavior can be specified by removing “Must be Answered” and “Ask Follow Ups” options and replacing them with a “Moderator Guidance” input field
June 5, 2025
Resolved Issues
The following issues were resolved:
- An issue was fixed with PowerPoint exports from Dashboards where the chart data in PowerPoint could not be edited.
- An issue was fixed in AI Interviews where the Executive Summary section of the default dashboard was empty.
May 29, 2025
Highlights
Additional Context for AI Probing in Surveys
Additional Context for AI Probing in Surveys
Surveys that contain the new AI Probing question type can now be enhanced with additional context information to guide the AI probing behavior. For example, it can be used to tell the AI more information about previous survey questions to inform it about how to ask probing questions.
Please note that the information provided in these fields is in addition to the standard (behind the scenes) prompts that are built into AI Probing questions.
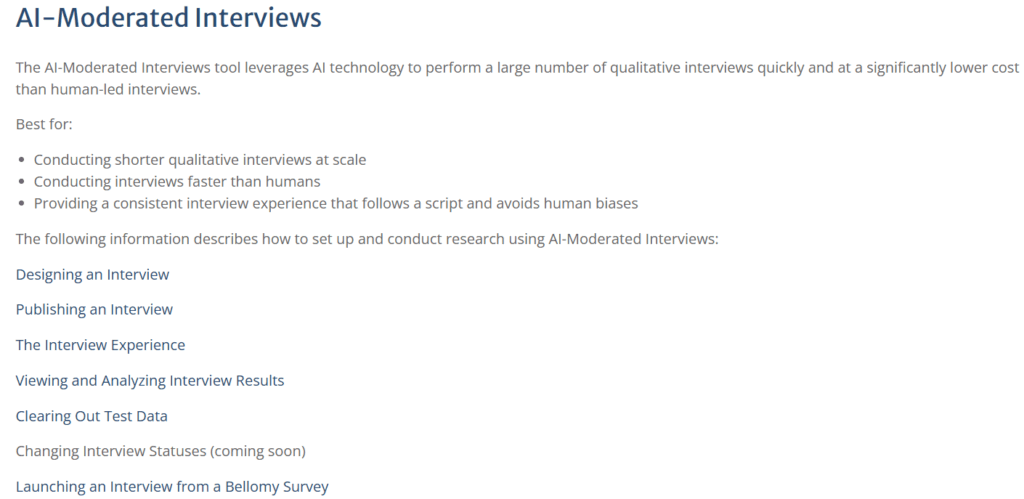
AI-Moderated Interviews
The AI-Moderated Interviews toolset is now available to Bellomy users on BellomyRC. Stay tuned for additional information about this that will be shared in the near future. Meanwhile, feel free to try it out!
There’s also information about it on the Help screens:
Resolved Issues
An issue was fixed for when a Crosstab using an AI Analytics datasource had Topics for rows and a date field (e.g. Time Started) as column(s). It now show results.
May 22, 2025
Highlights
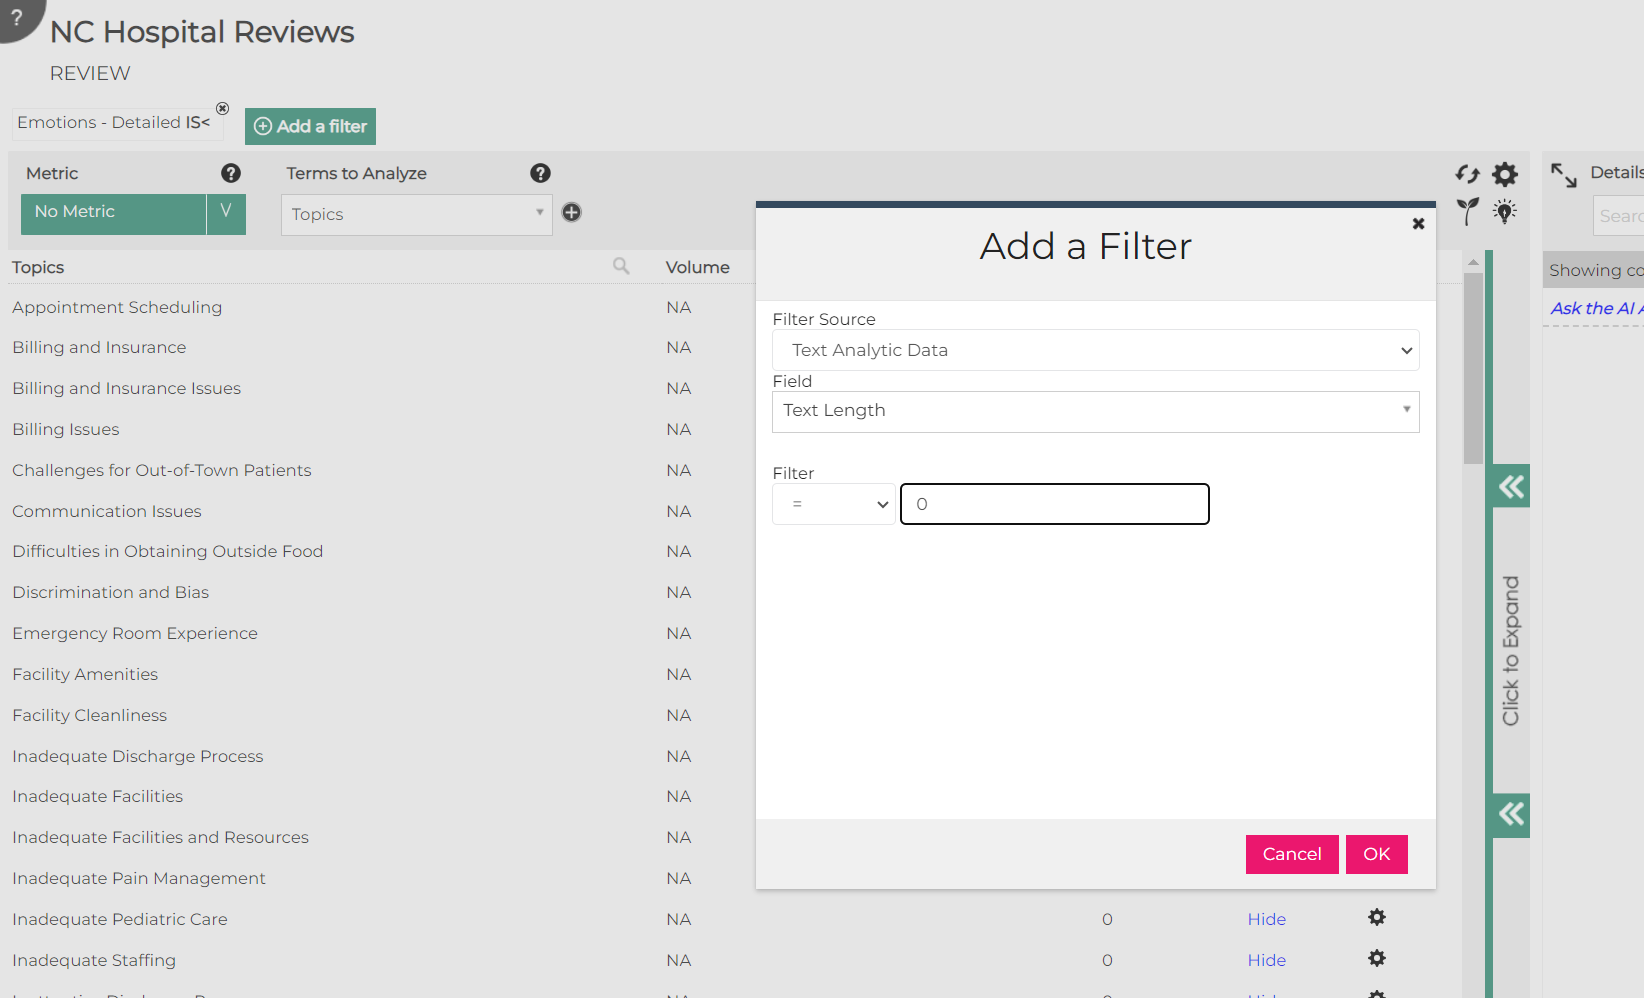
Easier Filtering of Numeric Fields in AI Analytics for Text
AI-Powered Quant Analyzer in Crosstabs
Easier Filtering of Numeric Fields in AI Analytics for Text
For numeric fields that have a small number of possible values (less than 15 of them), filtering can be via checkboxes rather than having to provide a range of numeric values:
AI-Powered Quant Analyzer in Crosstabs
A new Quant Analyzer feature has been added to Crosstabs, providing AI-powered insights from your
data. This feature appears at the bottom of the Results tab after all tables have been loaded.
Please note:
- for now, this is only available to Bellomy staff.
- this is an initial release and the user experience will be refined over time. Of course please forward any suggestions or other feedback to techfeedback@bellomy.com!
Resolved Issues
The following issues were resolved:
- Fixed an issue where Crosstabs was displaying data in incorrect columns when using certain TA datasets that have more than 15 columns.
- Resolved various dashboard exporting issues that were preventing users from properly exporting dashboard data.
- Fixed an issue where the export menu in Verbatims modules was appearing blank for survey data sources, preventing users from exporting verbatim data.
- Fixed issues with multi-choice fields in the Verbatims module that were causing the Details panel to go blank when certain question types were selected.
May 8, 2025
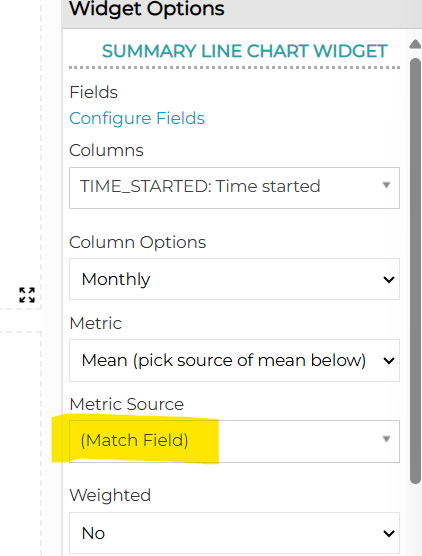
Separate Mean Metric Sources on Dashboard Summary Line Charts
The Dashboard Summary Line Chart widget now allows the Mean metric source to be tied to its respective field when calculating it for display. Prior to this change, only one field could be used as the metric source for all means (lines) on the chart.
For example, consider a line chart containing 3 lines intended to show means of Q1, Q2, and Q3. To calculate Q1’s mean based on Q1’s responses, Q2’s mean based on Q2’s responses, and Q3’s mean based on Q3’s responses, the “Match Field” metric source can now be selected:
A couple of other notes:
- the color palette has been expanded from 8 to 16 colors to accommodate charts that have a larger number of lines.
- this release also fixes an issue with this widget when it was on a previously-created/saved dashboard. Sometimes the widget would change the metric used to display data (e.g. if the widget was previously set up to display percentages, sometimes it would display counts when the dashboard was re-opened). The data itself was correct, but it was displayed using the wrong metric.
- there are some known issues with Excel and PowerPoint exports from this widget. The development team is working on those now and they will be in an upcoming release.
May 1, 2025
Highlights
Dashboard Simple Crosstab and Summary Table Widget Exports to PowerPoint
Dashboard Filters in PowerPoint Exports
Dashboard Simple Crosstab and Summary Table Widget Exports to PowerPoint
Simple Crosstab and Summary Table widgets are now included in PowerPoint exports.
Dashboard Filters in PowerPoint Exports
The filters applied to a dashboard, widget, and dashboard page are now included in dashboard exports to PowerPoint:
April 17, 2025
Highlights
Nets Highlighted in Crosstabs Results
Client Users Can Tag Insights Objects
Nets Highlighted in Crosstabs Results
Nets are now highlighted in bold in Crosstabs results and Excel exports to distinguish them from other, non-netted rows in the output.
Client Users Can Tag Insights Objects
Insights Objects tags are a powerful way to group and retrieve sets of related Insights Objects such as Crosstabs, Dashboards, Query Tools, AI Analytics Datasets, etc. Client users who have the “Client Creator” permission to create those types of objects were previously unable to tag their own Insights Objects and therefore could not take advantage of this capability. Now they can via the new Tagging option:
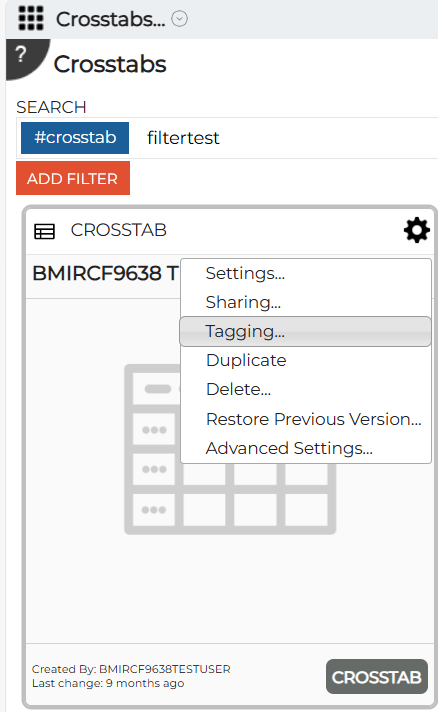
This option launches a dialog where custom tags can be added or removed:
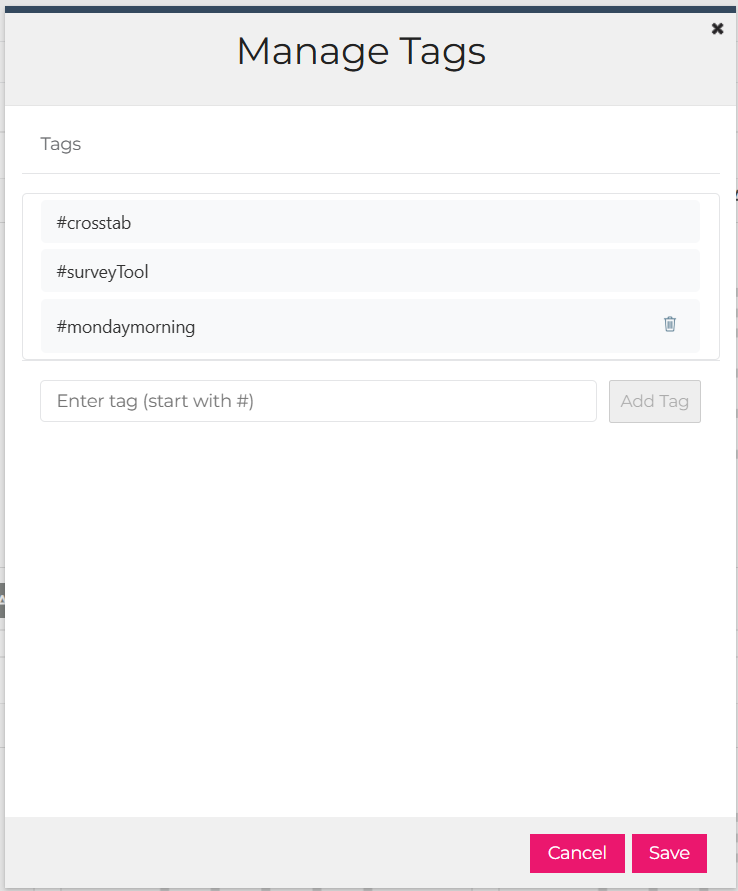
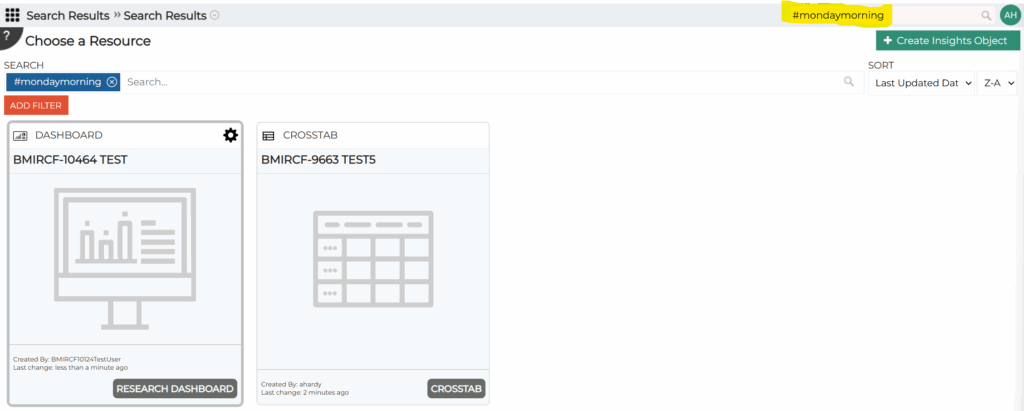
Please note that certain system tags that the Research Cloud needs for managing these objects can’t be removed. In the example above, the #crosstab and #surveyTool tags are system tags that can’t be removed. The #mondaymorning tag was added by the user so they can remove it using the trash can icon.
An additional note about tags: once they are added, it’s easy to find Insights Objects in the RC by searching for the tag. In the example below, the RC search bar (in the upper right corner) was used to search for all objects tagged with #mondaymorning. A dashboard and a crosstab tagged that way were returned in the search results.
Resolved Issues
The following issues were resolved:
- In Crosstabs, custom table headers now appear just above their respective custom table in Excel exports. Prior to the fix, custom table headers appeared to be part of the output for the previous table in the output.
- In Crosstabs, when the Quarterly trending option is chosen for columns and a filter is specified on the results, the quarters now appear in the correct order in the results. Previously, when the filter was added it would cause the quarters to display out of order.
- In Insight Objects (the cards the represent Crosstabs, Dashboards, Query Tools, etc) Advanced Settings, a bug was fixed that was preventing any of the advanced settings from being edited if that Insights Object was also shared with a username containing a period.
- An issue was fixed with PowerPoint exports where the chart data in PowerPoint could not be edited. When clicking on an exported chart in PowerPoint, the Edit Data pop-up option no longer returns an error message.
April 10, 2025
Highlights
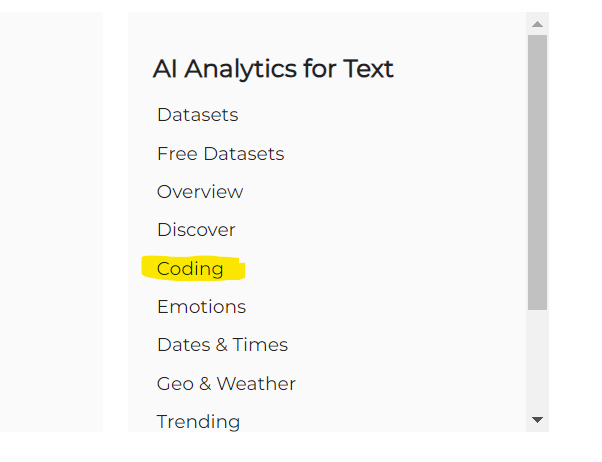
Coding via the AI Analytics for Text Tool
AI Analytics Usage Report Record Counts
Dashboard Filters in PowerPoint Exports
Expandable Quotas and Custom Variable Filter Input Fields
Coding via the AI Analytics for Text Tool
Survey open ends can now be coded using the AI Analytics for Text tool. After doing topic modeling, the new dataset coding tool can be used to assign the topics as codes in the survey responses. Please note that this replaces the old AI Coding tool that was on the PM Site – that tool has been removed from the PM Site.
AI Analytics Usage Report Record Counts
The AI Analytics Usage Report now resets the count of records loaded for each dataset at the beginning of the current license period to make it easier to see and manage usage.
Dashboard Filters in PowerPoint Exports
Dashboard filter values are now included in PowerPoint exports.
Expandable Quota and Custom Variable Filter Input Fields
The input fields for the filters used to define quotas and custom variables on the PM Site can now be expanded to make it easier to see the values that were entered in those fields.
Resolved Issues
The following issues were resolved:
- In Crosstabs, means and standard deviations were being output to the wrong columns in Excel exports.
- In Crosstabs, rounding was not correct for percentages that were displayed to zero decimal places. The issue was causing values in Excel exports to be different from what was displayed on the screen.
- Disabled stubs no longer appear on the PM Site Survey Design page.
- An issue in AI Analytics was causing datasets not to load. This was happening when custom topic modeling options were selected.
March 27, 2025
Resolved Issues
The following issues were addressed In AI Interviews:
- Additional system logging capabilities were put in place to gather information when an interviewee gets an “undefined” message at the top of the interview. This will record information to help diagnose the problem if it happens again.
- An Insights Suite object is now created when an interview is duplicated.
- The time recorded in AI Interview responses is now in the same time zone as survey responses.
March 20, 2025
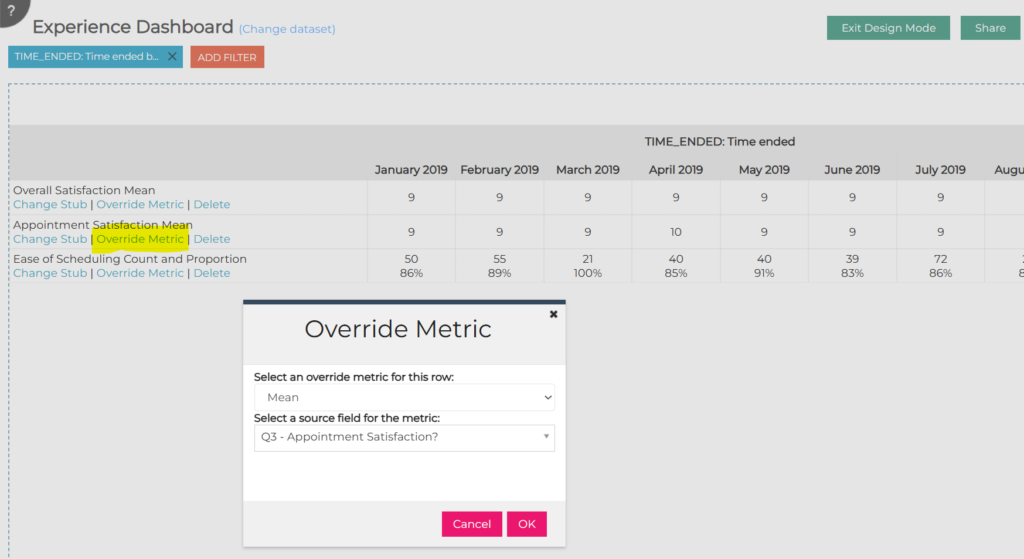
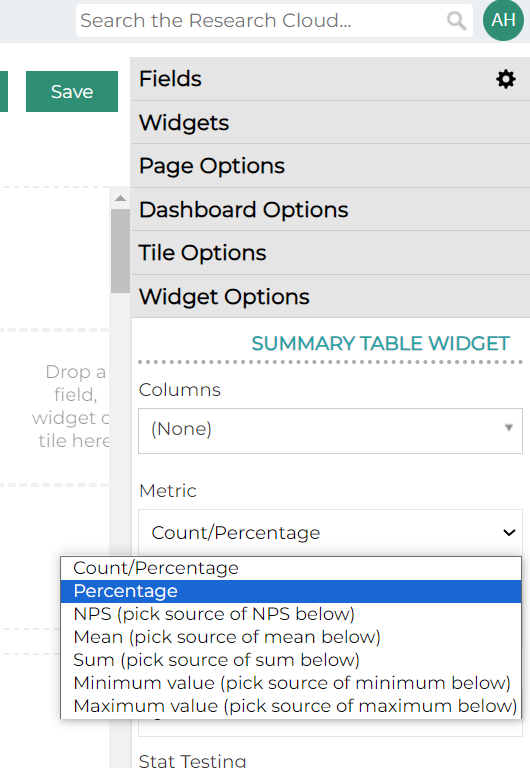
Dashboard Summary Table Enhancements
The Summary Table widget in Dashboard was previously limited to only showing one kind of metric (mean, count, percentage, etc.) across all rows in the table. Also, Means were limited to all being based on the same source field. This widget has been enhanced so that a different metric type can be specified for each row, and a separate field can be selected for each mean row in the table.
In the example below, rows in the same summary table contain a mixture of means and counts/percentages. The new Override Metric link on each row allows the metric for that row to be specified:
March 13, 2025
Resolved Issues
- In AI Analytics for Text, Chat sessions are now reset when filters are changed on the page since the displayed text records can change with filter changes.
March 6, 2025
Resolved Issues
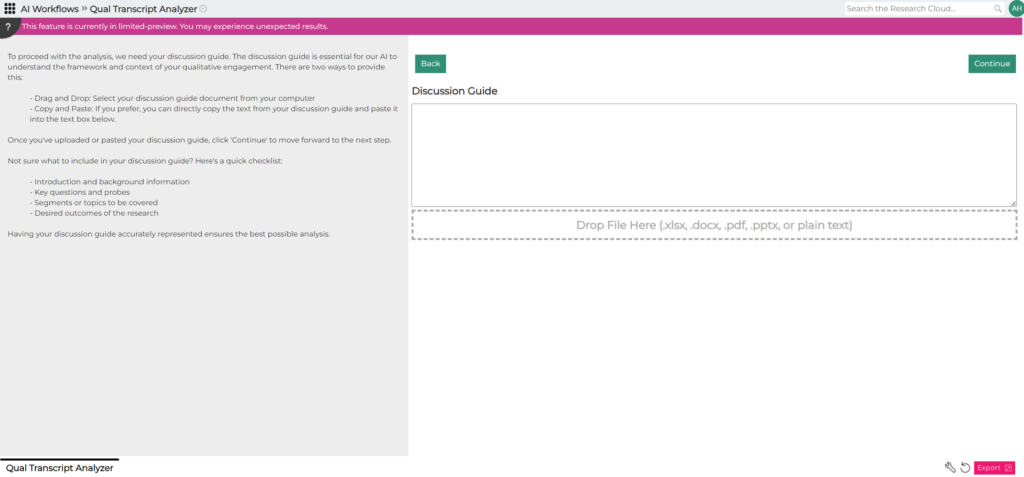
- In AI Workflows, an issue where chat was not available on the last step of the Qual Analyzer has been fixed.
February 27, 2025
Highlights
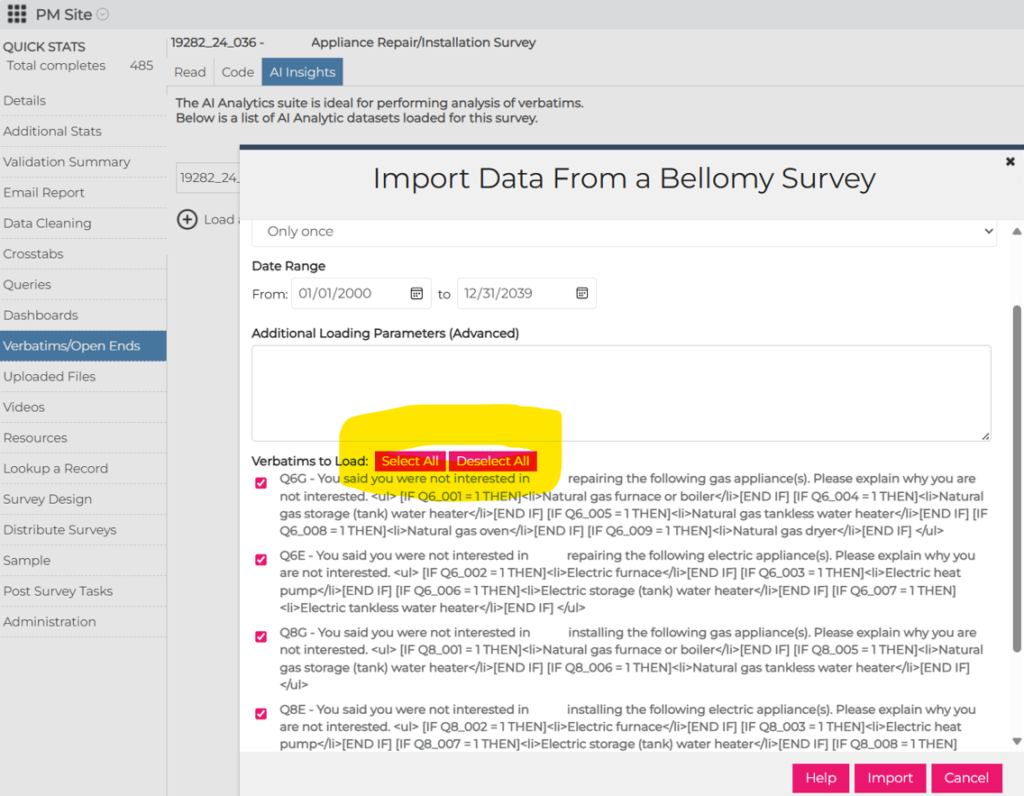
‘Select All/Deselect All’ in Verbatims/Opens End on PM Site
Select All/Deselect All in Verbatims/Open Ends on PM Site
On the PM Site, Verbatims/Open Ends, AI Insights option for loading a new dataset, Select All/Deselect All buttons have been added to make it easier to select which open ends should be included. This is helpful for surveys that have a large number of open ends.
Resolved Issues
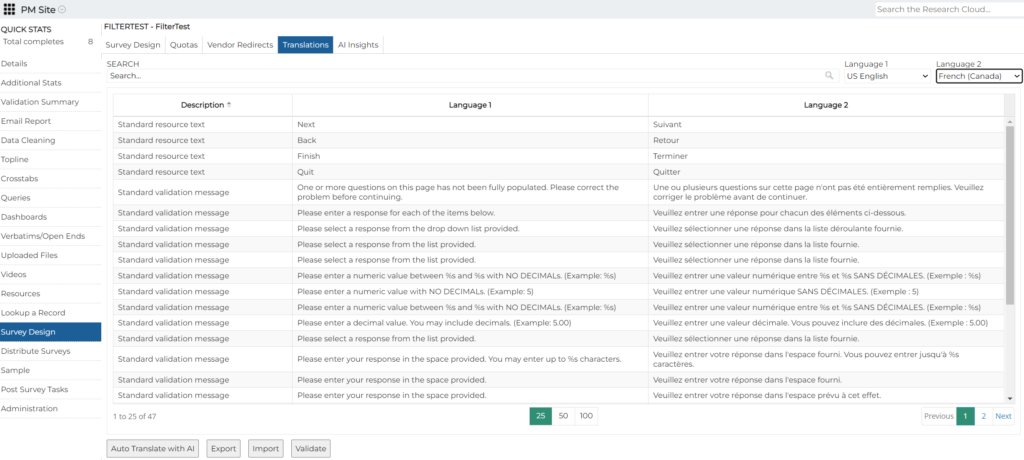
- On the PM Site, an issue was fixed with the Auto Translate with AI tool under Survey Design, Translations. Occasionally that tool was returning incorrectly formatted translation text.
February 20, 2025
Highlights
Dashboard Filters in Excel Exports
Dashboard Filters in Excel Exports
Dashboard filters are now included in Excel exports. Page filters, widget filters, and field filters are all included at the top of the Excel worksheet.
AI Analytics Chat Protections
The AI Chat feature in AI Analytics was occasionally providing famous quotes rather than quotes from the loaded data. It has been enhanced to only draw quotes from the data.
Resolved Issues
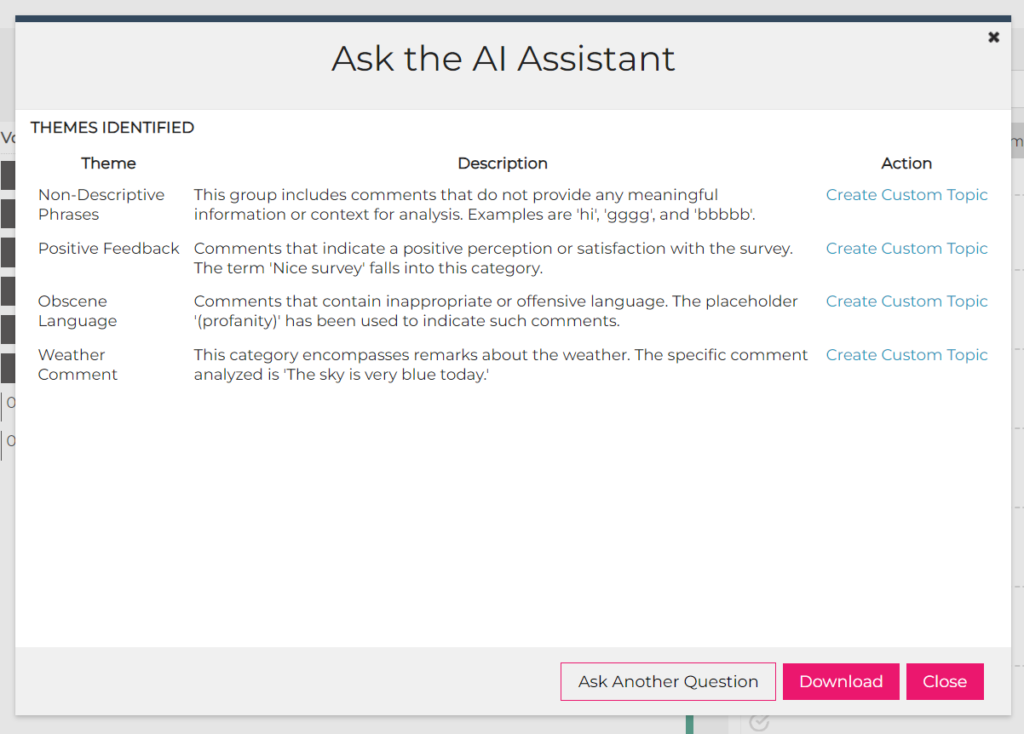
- A misspelling in the text at the top of the Ask the AI Assistant dialog was corrected.
- In the Summary Table dashboard widget:
- Sometimes when the column was selected, the widget would expand to be wider than the dashboard canvas – this was fixed.
- Stat testing letters are now exported to Excel.
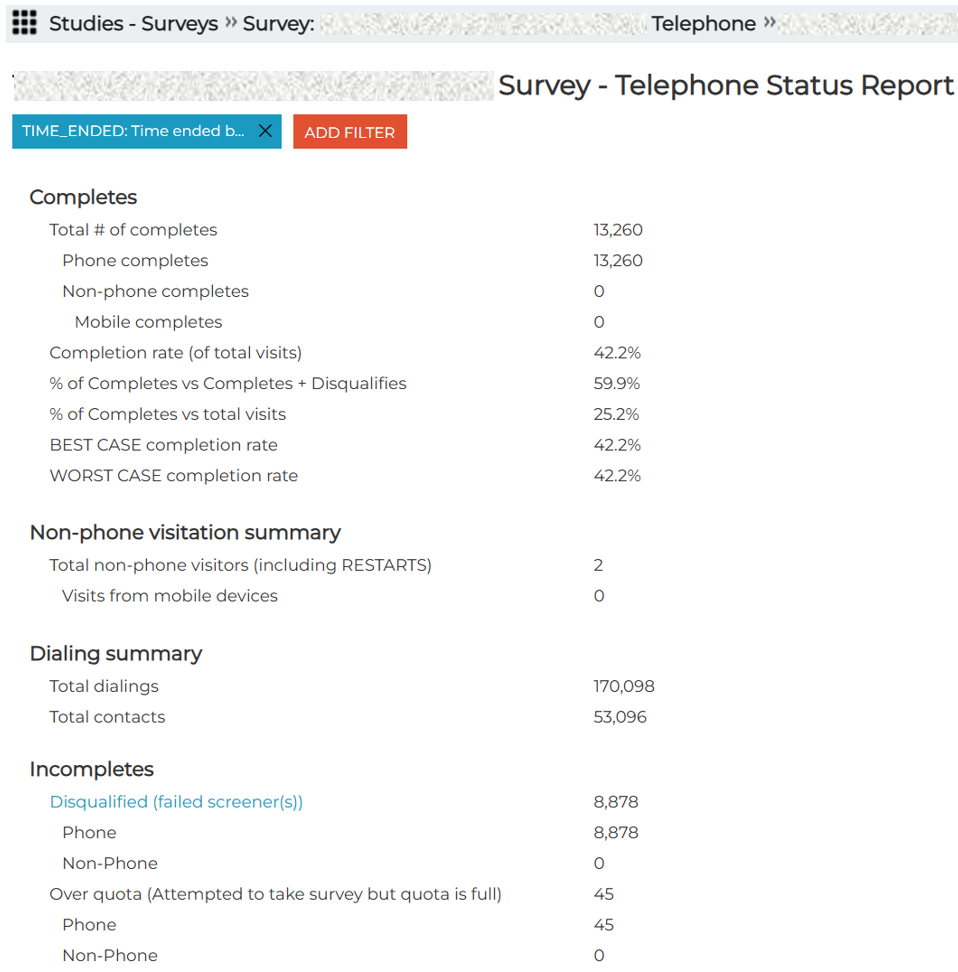
- On the PM Site Detailed Stats for a survey, a filter issue was causing Total Visits to be different than on the Status Report on the client RC. It has been fixed.
February 6, 2025
50 Rows of Tiles on a Dashboard
Dashboards can now have up to 50 rows of tiles. The previous limit was 20 rows of tiles.
Resolved Issues
On Dashboards, there was an issue where bar and column charts were not showing numbers for bars/columns to the number of decimal places specified in Widget Options. This has been fixed. Note: trailing zeros (i.e. 7.500 when it’s set to 3 decimal places) can’t always be displayed due to limitations with the charting software used by the RC.
January 23, 2025
Highlights
Daily Full Reload of AI Analytics Datasets
Enable/Disable Case Management Triggers
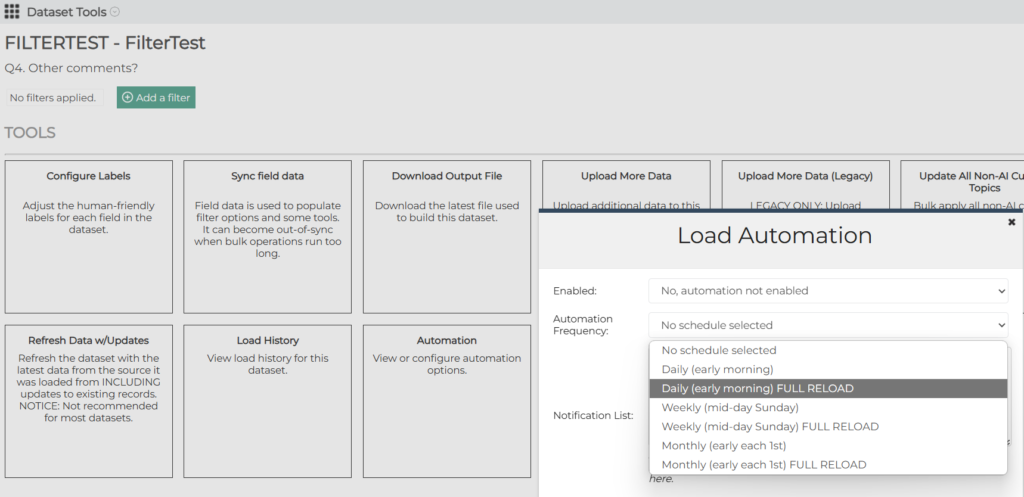
Daily Full Reload of AI Analytics Datasets
AI Analytics data from surveys can be completely reloaded on a daily basis. Reloads will automatically occur in the overnight/morning hours. This can be set up a couple of ways:
1) When the dataset is first loaded via the ‘Load New Dataset’ button:
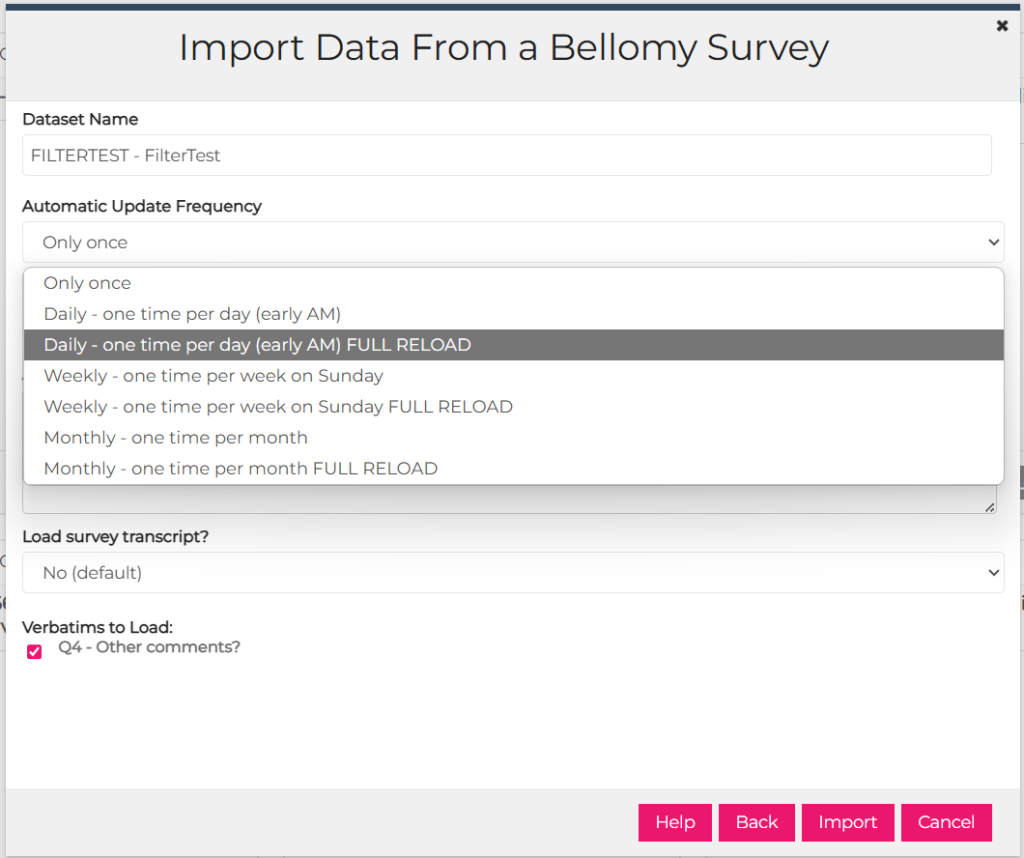
2) In Dataset Tools
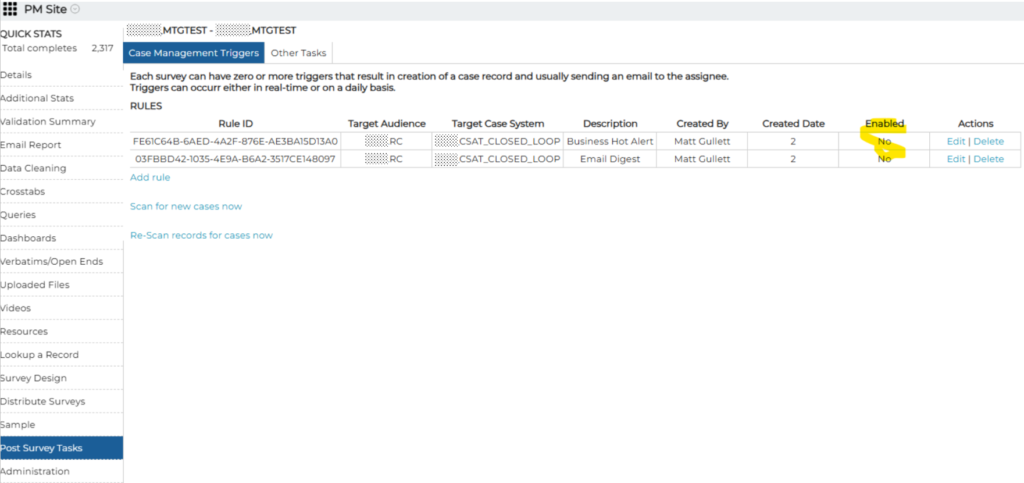
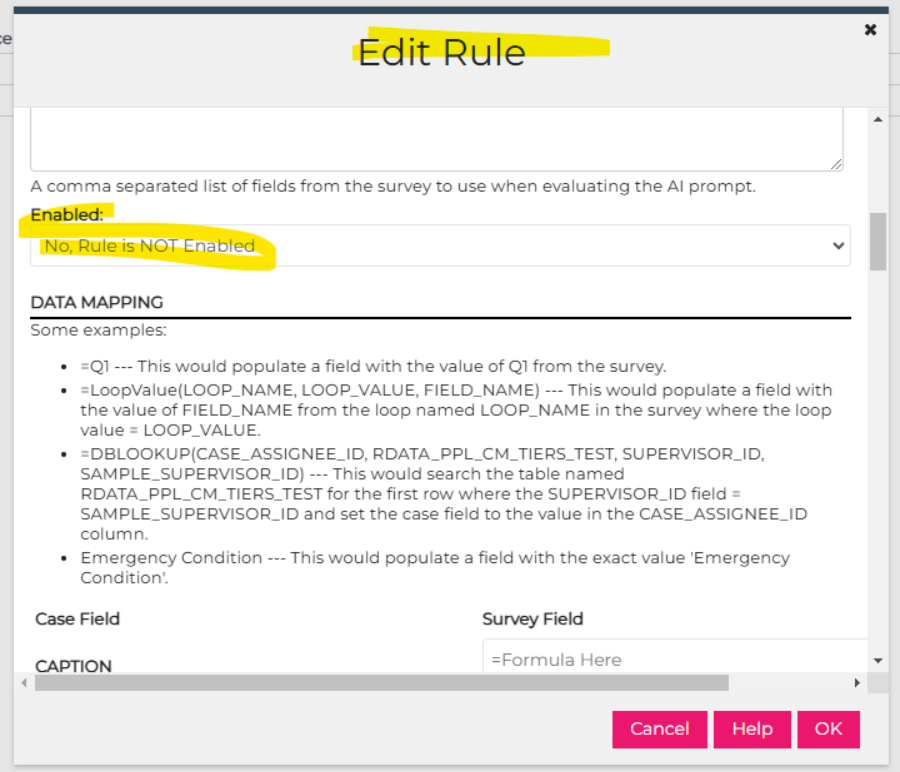
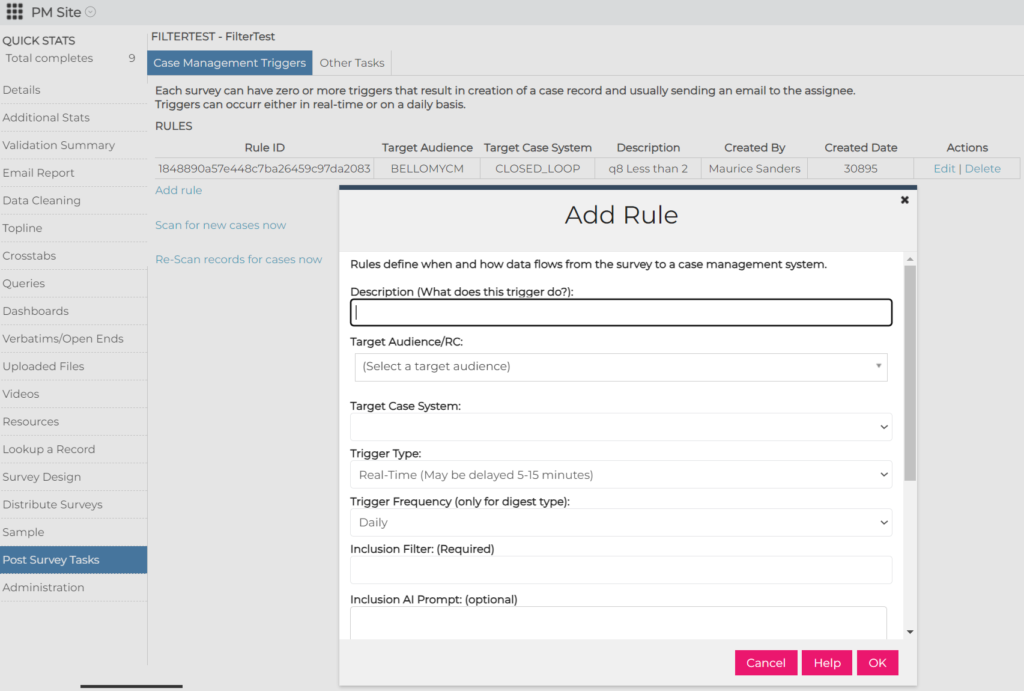
Enable/Disable Case Management Triggers
Case Management triggers can now be enabled or disabled on the PM Site.
January 9, 2025
Resolved Issues
In Crosstabs:
- When someone uses the Save a Copy button to create their own copy of a Crosstab, they are now the owner of that new Crosstab so they can share it and manage it.
- When there is a large number of columns in Results and more than 26 stat testing letters are required,   was displayed in place of additional stat testing letters. This has been fixed so that nothing is displayed for stat testing differences beyond the 26th column.
December 19, 2024
Highlights
Quota Report – Frame Selection with Multiple Quotas
AI Analytics Dataset Duplicate Record Cleanup
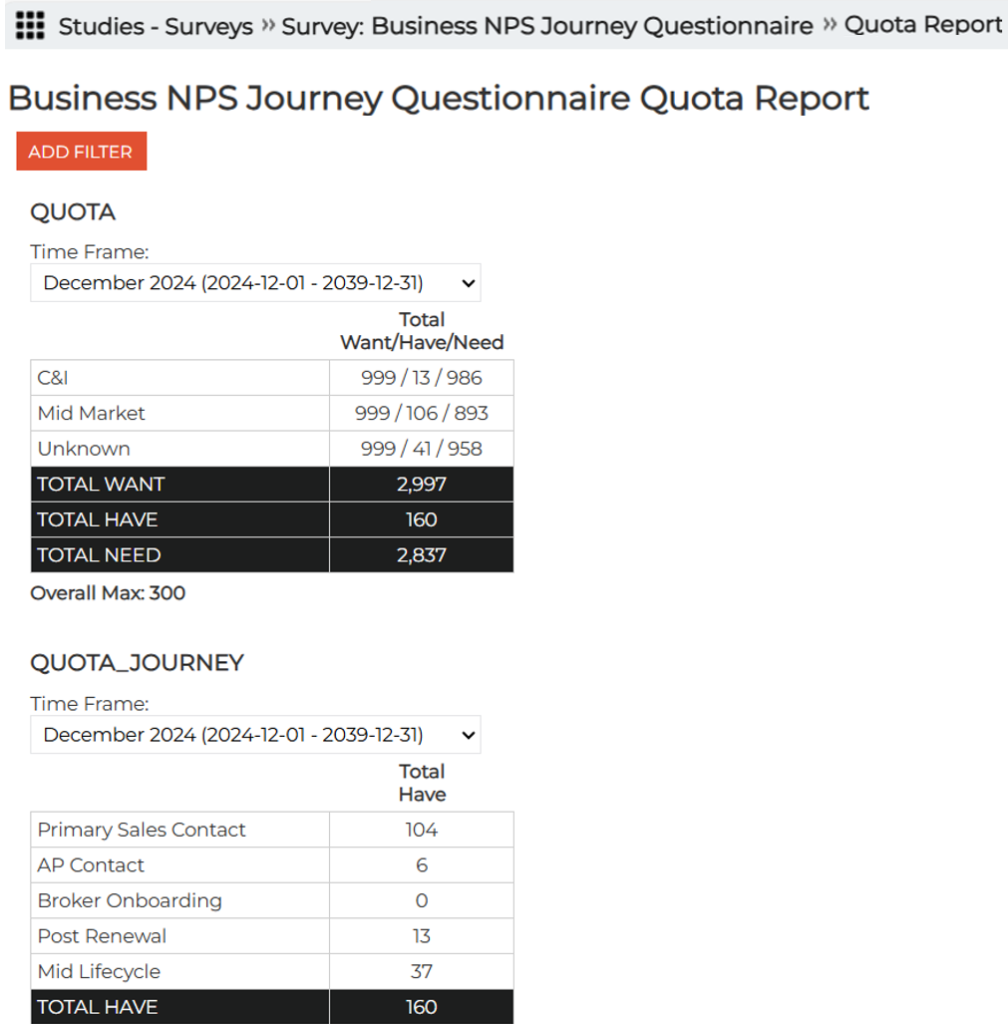
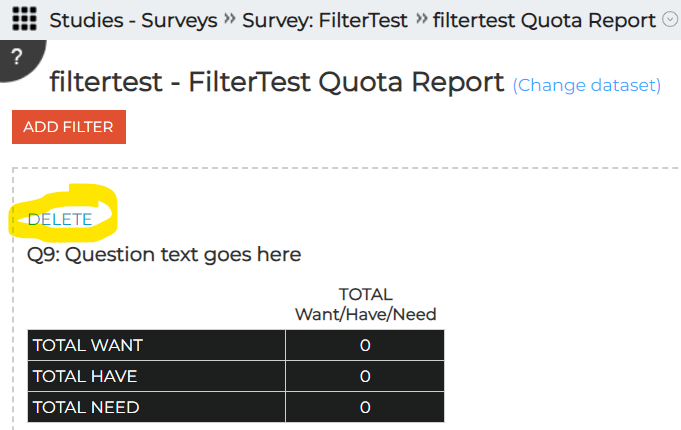
Quota Report – Frame Selection with Multiple Quotas
On RC Quota Reports (the ones available under Surveys, not on the PM Site), the ability to select the Time Frame for each quota separately has been added:
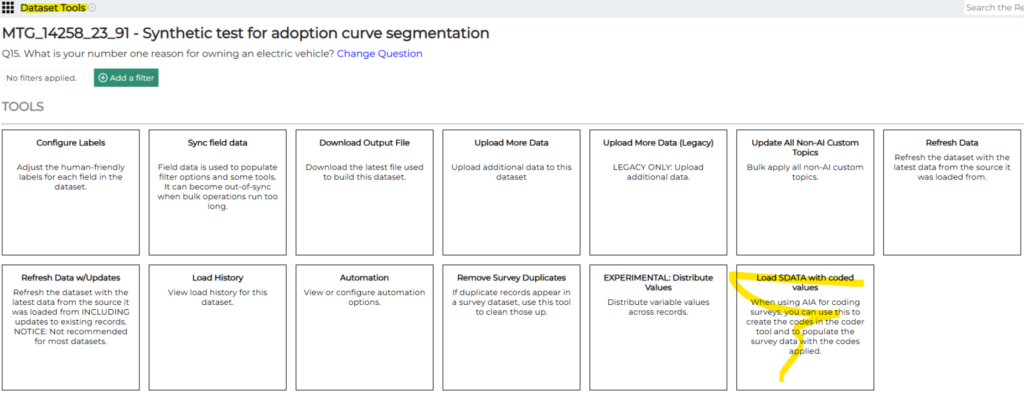
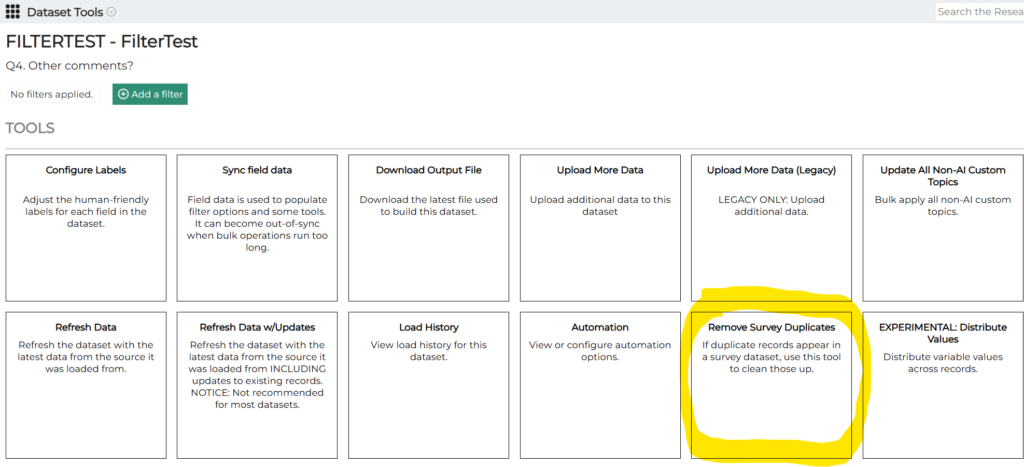
AI Analytics Dataset Duplicate Record Cleanup
In rare cases there can be duplicate records in AI Analytics datasets. They can now be removed using a tool that has been added to Dataset Tools:
Resolved Issues
In the AI Workflows Bulk Text Analyzer, an issue was corrected where chat sessions were getting stuck due to workflows that were using old, no longer supported AI models.
December 12, 2024
Resolved Issues
The following issues were fixed:
- In AI Analytics, an issue was fixed where not all available topics in the Assignments tool were showing up.
- In Crosstabs, an issue where Summary Tables in Crosstab would not export to Excel was fixed. This was happening when there were empty rows and more than one nested column.
- In Crosstabs, issues where Total Answering could be inaccurate were fixed. This could occur when:
- there were two multiple choice questions used as nested columns
- a multiple choice question was used as a row and another multiple choice question was used as a column.
- In the Query Tool, a problem was fixed with updating a single choice response to Blank (it was setting it to an asterisk).
December 5, 2024
Highlights
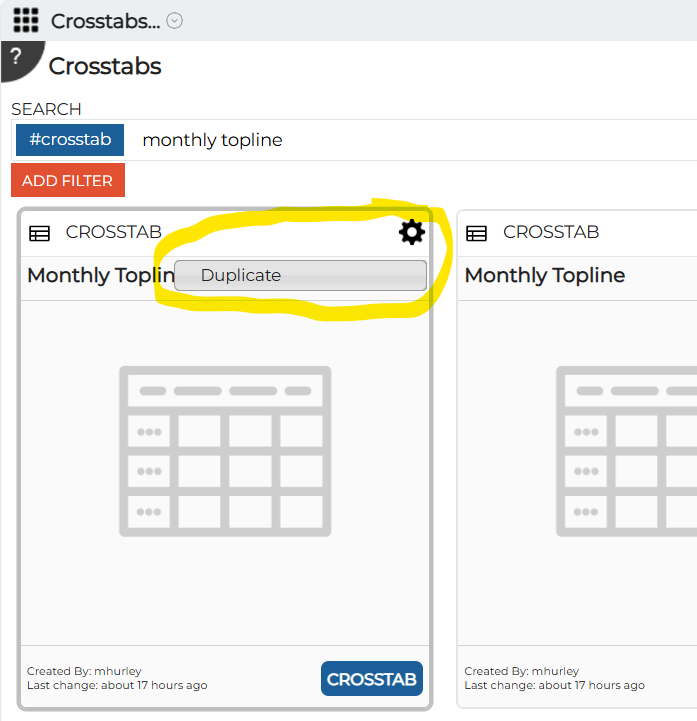
Client Users Can Duplicate Crosstabs, Dashboards, Queries, etc.
Hidden Field Used in RC Tool Filters Grayed Out
Client Users Can Duplicate Crosstabs, Dashboards, Queries, etc.
Client users can duplicate Insights Objects such as Crosstabs, Dashboards, Queries, etc created by others. For example, a Bellomy CST member can create a Crosstab and client users can duplicate it if they want to have a version with their own changes. Please note that the user has to be a member of the “Client Creators” security group on that Research Cloud. Also, they can only duplicate objects they have been shared with them.
Hidden Fields Used in RC Tool Filters Grayed Out
In situations where a field is needed for filtering but we don’t want client users to incorporate that field into other aspects of Dashboards, Crosstabs, or Query Tools, the field is hidden and the filter is grayed out. Previously, if the user clicked on the grayed out filter it would pop up a confusing filtering options dialog. That has been changed so that nothing happens if they click on a grayed out filter.
Resolved Issues
The following issues were fixed:
- Another issue in Crosstabs where some results were displaying “Infinity%” has been fixed.
- Also in Crosstabs, there were instances where no data was showing for nets that were created for custom variables. This has been fixed.
- In Employee Coaching, the icon now appears on the Agents cards.
November 21, 2024
Highlights
Legacy Topline Retired
The legacy Topline report has been retired from the PM Site. It has been replaced by Crosstabs. For more info, please see the October 3 Release Notes.
Resolved Issues
The following issues were fixed:
- An issue in Crosstabs where some results were displaying “Infinity%” has been fixed.
November 14, 2024
Highlights
Rating_Grid and mlinetext Question Types now in Automatically-Generated Topline
Row Label Customization in Dashboard Summary Tables
Display Stub Values in Query Tool
Rating_Grid and mlinetext Question Types now in Automatically Generated Topline
These question types have been added to the Topline that can be automatically generated in Crosstabs.
Row Label Customization in Dashboard Summary Tables
In Dashboard Summary tables, the row labels can now be customized. This is helpful for cases where there are loop values that should not be displayed in the table:
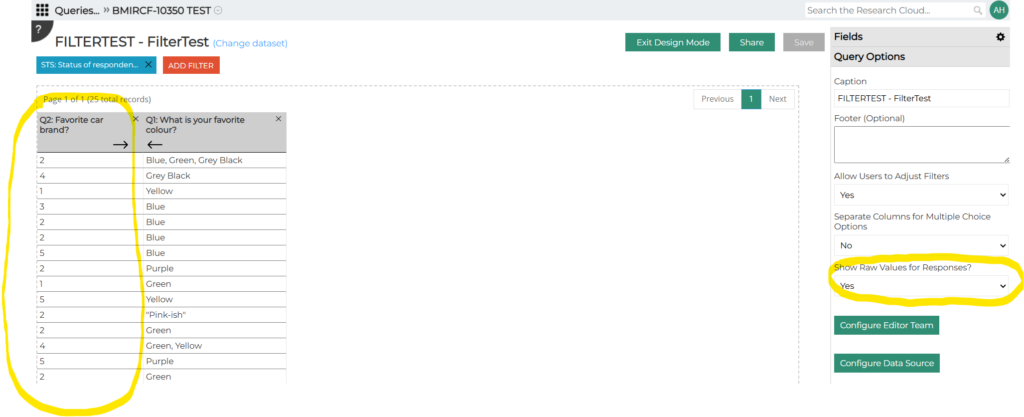
Display Stub Values in Query Tool
In the Query Tool, the underlying values for stubs can now be displayed via a new Query Option:
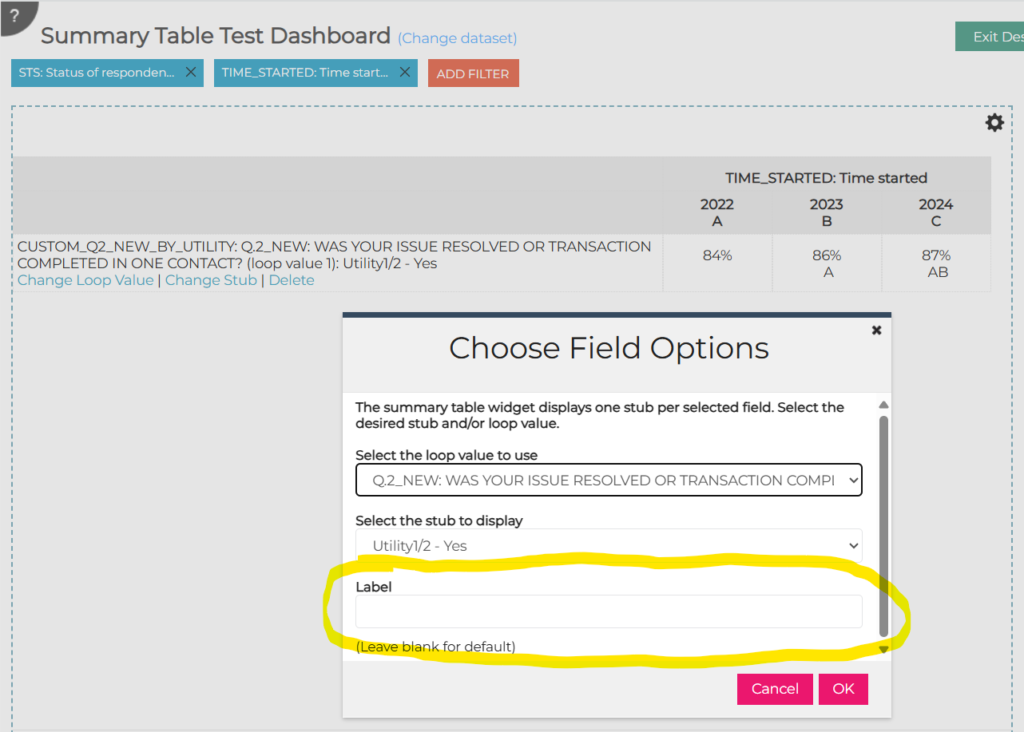
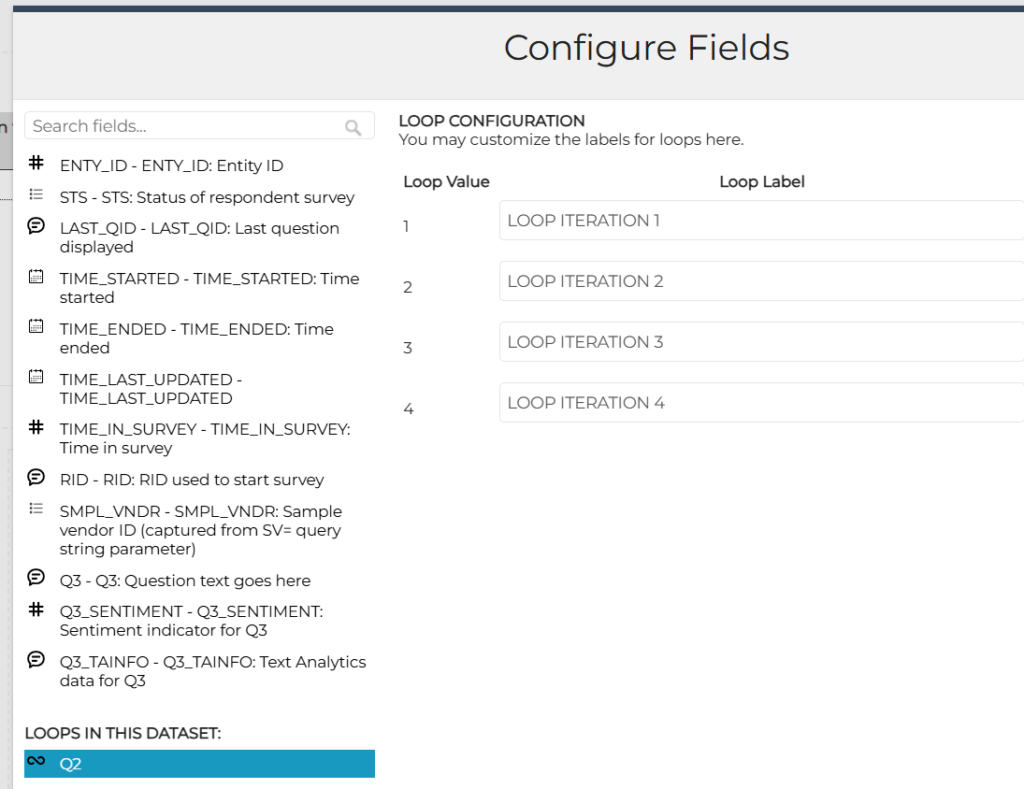
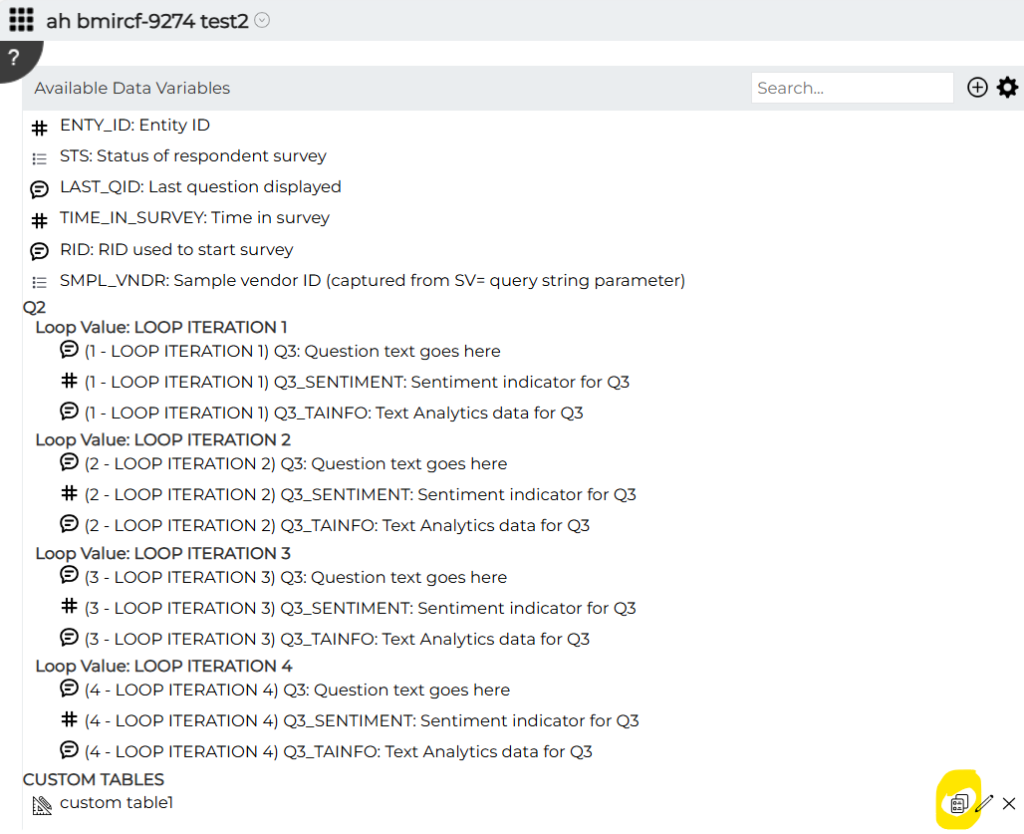
Loop Labels Can Be Customized
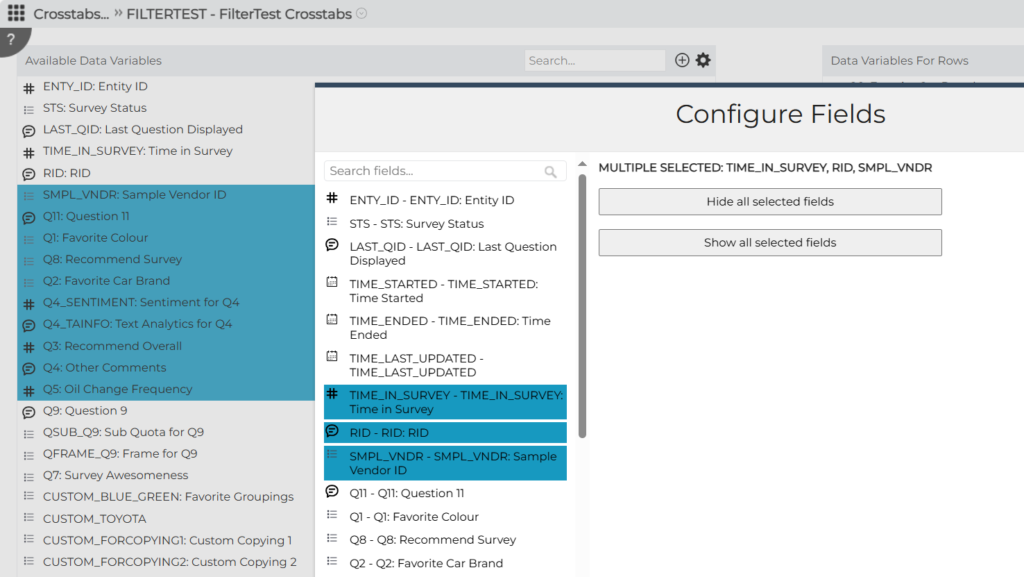
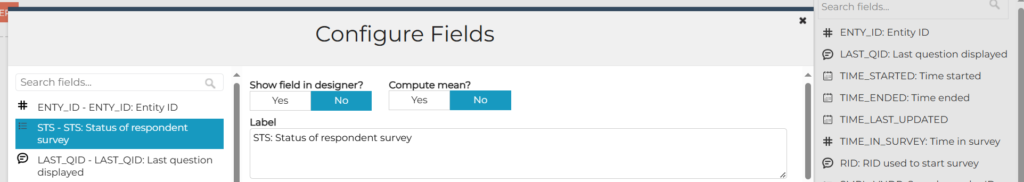
In the Query Tool, Dashboards, and Crosstabs, loop labels can now be customized via the Configure Fields dialog:
Resolved Issues
The following issues were fixed:
- Data on Agents Comparison is now shown to decimal places.
- In AI Analytics, an issue was fixed where Emerging Topics sometimes was not presenting any topics.
- Case Management was changed to export case verbatims to CSV so that the text is not cut off (with “…” at the end).
- An issue was corrected in Case Management so that a resolution is not set before the case is resolved or closed.
- In the Query Tool, an issue was fixed where column widths were not being saved/applied.
- In Crosstabs, an issue was corrected where rows that were nets of stubs for a multiple choice question did not contain any data.
- Dashboards that contain Simple Crosstab or Summary Table widgets can now be exported to Excel.
November 7, 2024
Highlights
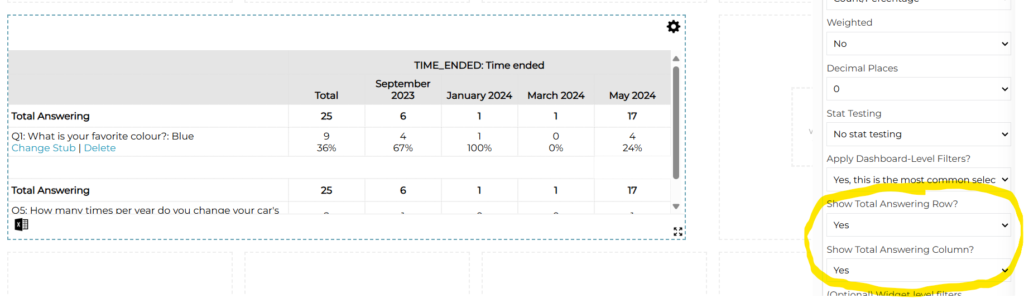
Show/Hide Total Column on Dashboard Summary Table
Hide Total Row/Column on Dashboard Summary Table
On the dashboard Summary Table widget, the Total Answering row and the Total column can now be turned on or off using new widget options:
Resolved Issues
The following issues were fixed:
- A survey’s disabled stubs and banners are no longer displayed on the PM Site’s Survey Design page when the option to show disabled objects is turned off.
October 31, 2024
Highlights
Total Answering On/Off in Dashboard Simple Crosstab
Total Answering On/Off in Dashboard Simple Crosstab
On the dashboard Simple Crosstab widget, the Total Answering row can now be turned on or off using a new widget option:
Resolved Issues
An issue was fixed with files downloaded from Site Resources so that .XLSX (Excel) files are no longer converted to .XLS files during the download.
October 24, 2024
Highlights
Lines on Bar and Column Charts
Omitting Choices from Mean Calculations
Lines on Bar and Column Charts
On dashboards, lines can now be displayed on bar and column charts to show targets or goals.
In Widget Options, a “Configure vertical (or horizontal) lines & ranges” button is available. This is used to set up the values and appearance of the line that should appear on the chart.
Omitting Choices from Mean Calculations
In Crosstabs, in some cases it’s important to be able to include an option such as “Don’t Know” in the Total Answering (e.g. for proportion calculations) but to omit it from the mean calculation. This can be done by setting the Mean Recode Value for that stub to -1:
Resolved Issues
The following issues were resolved:
- An issue was fixed in Crosstabs where an extra column was displayed when trending by dates and using side-by-side columns.
- On the PM Site, an issue was fixed with an error that was occurring when using the Lookup Record tool for surveys programmed on the panel platform.
- -999999 no longer appears in front of combined variable names for fields in Crosstabs.
October 10, 2024
Highlights
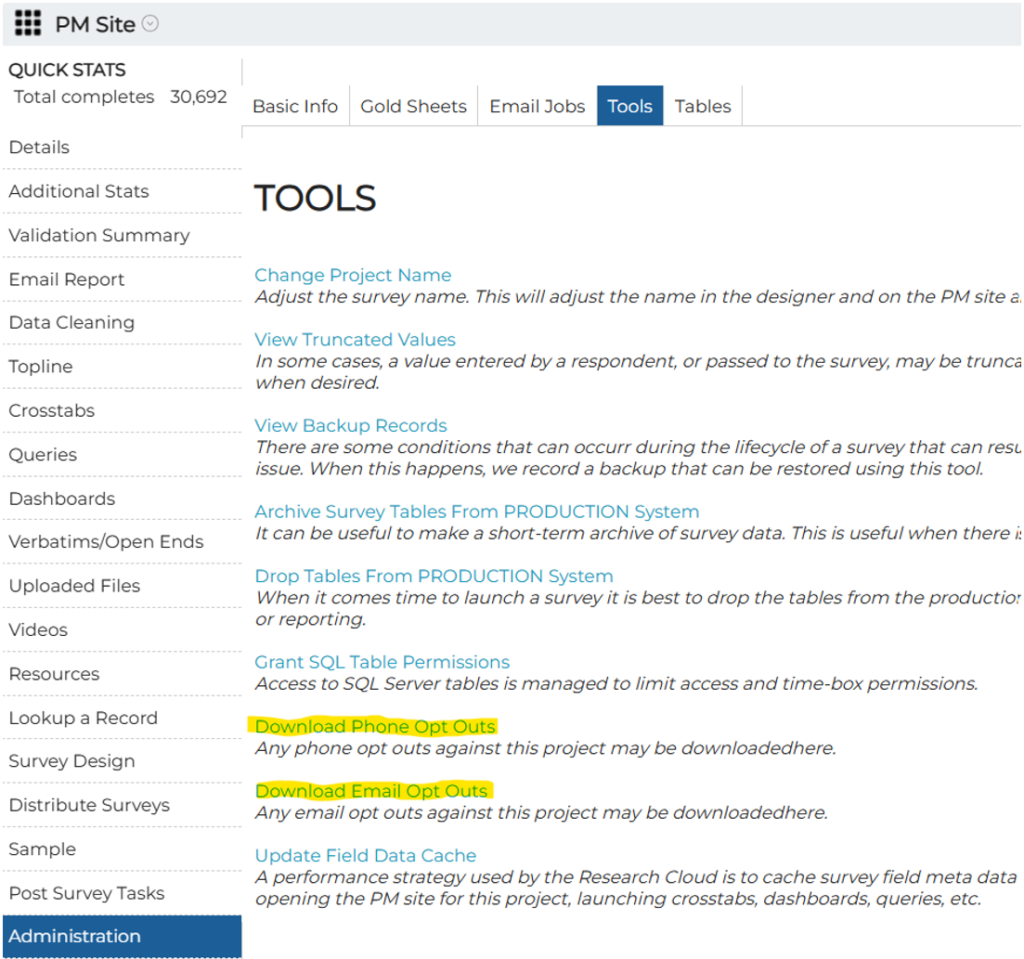
PM Site – Download Phone and Email Opt Outs
AIA Ask the Assistant – Improved Prompting
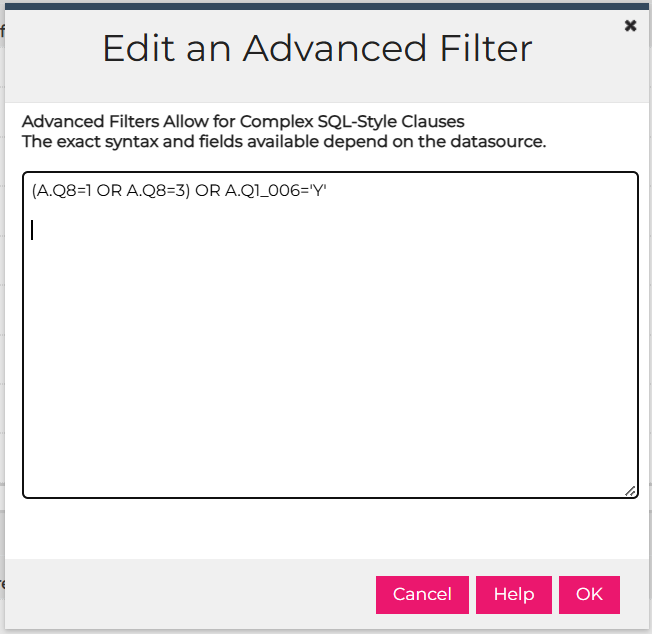
Advanced Filters
In Research Cloud tools such Crosstabs, Dashboards, etc. the filtering capabilities have been enhanced with an advanced option.
This allows for complex filter conditions to be specified (e.g. show this OR that). This initial implementation uses a scripting approach rather than a point-and-click user interface so it requires some knowledge of SQL syntax. For additional detail please see the documentation available via the Help button.
PM Site – Download Phone and Email Opt Outs
Opt Outs can now be downloaded to Excel.
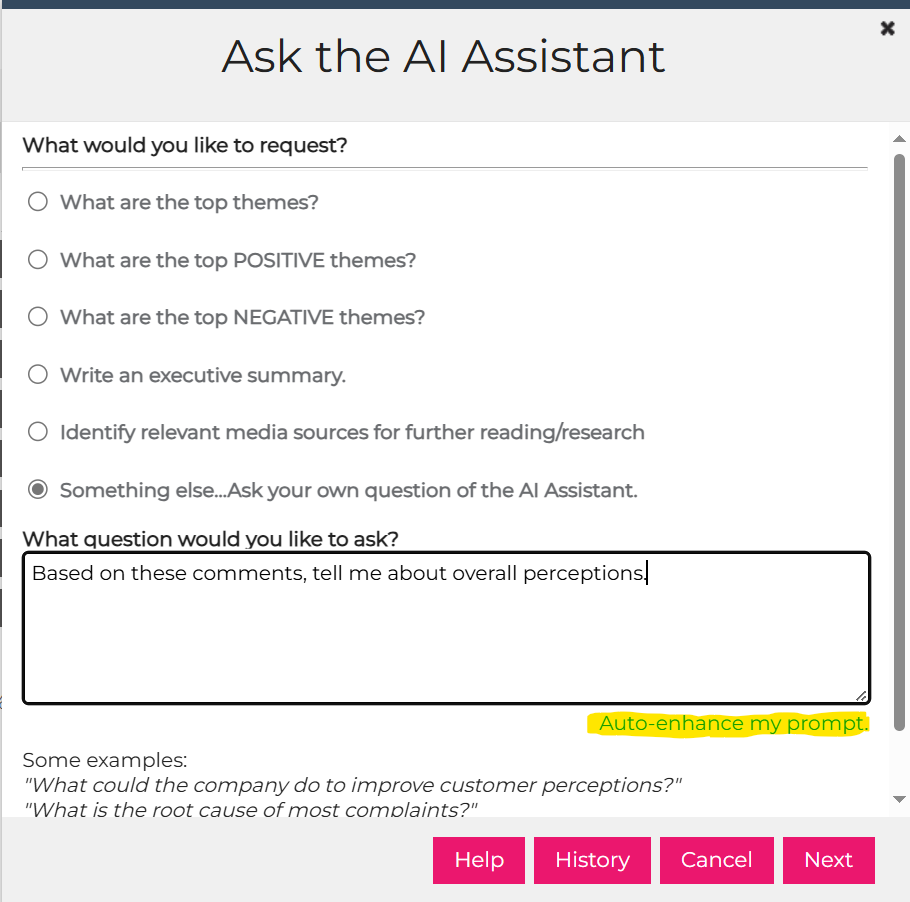
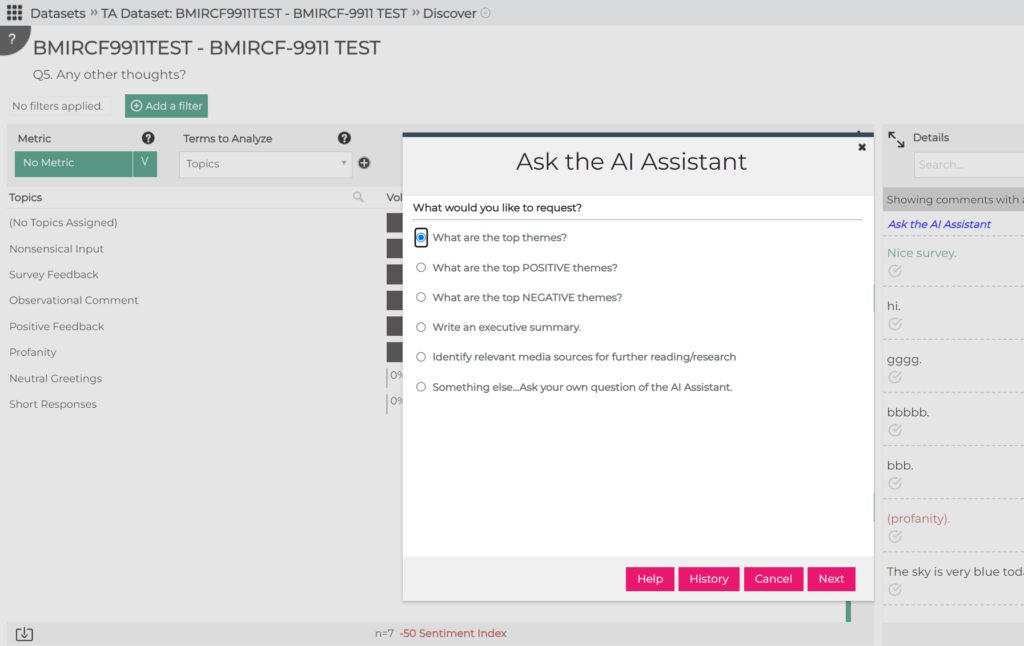
AIA Ask the Assistant – Improved Prompting
Ask the Assistant has been improved that you can ask for help with prompting the AI.
When the option to ask your own question of the AI Assistant is used, your question (prompt) can be analyzed and enhanced to provide better results:
Resolved Issues
In Dashboards, an issue was corrected where line charts were not displaying custom variable values correctly.
October 3, 2024
Highlights
PM Site – Search Through Allowed Audiences
AIA Usage Report – Select Datasets to Include
Copying Custom and Summary Tables
Auto Configure for Relabeling Fields/Stubs and Creating Nets
Reuse Query with another Dataset
AI Workflow Wizard – OpenAI o1-preview Model
Hide Several Fields at a Time
In Configure Fields, several fields can now be hidden at a time so that they won’t be visible in Crosstabs in the Rows or Columns lists, or in Dashboards or Query Tool in the Fields list. This can help when one of these is being set up for a client and there are a lot of fields they do not need to see. Please note that this can also be used to hide additional (“overlaid”) variables from panels etc.
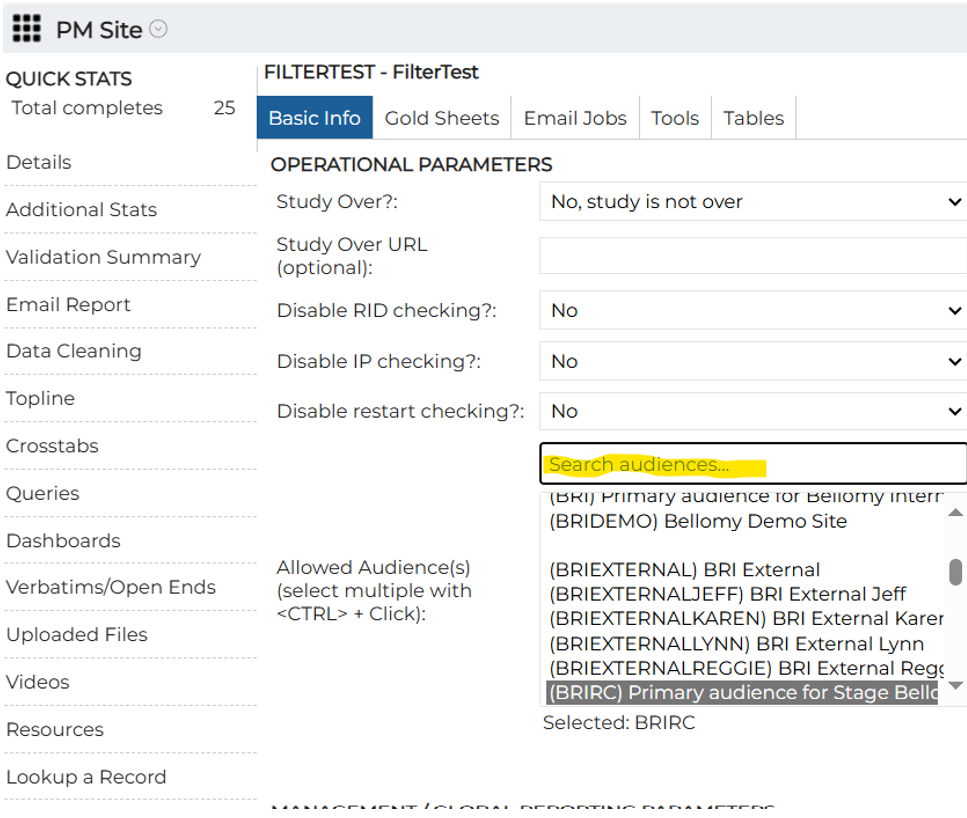
PM Site – Search Through Allowed Audiences
A search box is now available on the PM Site Administration page to quickly locate the audience to set for a project.
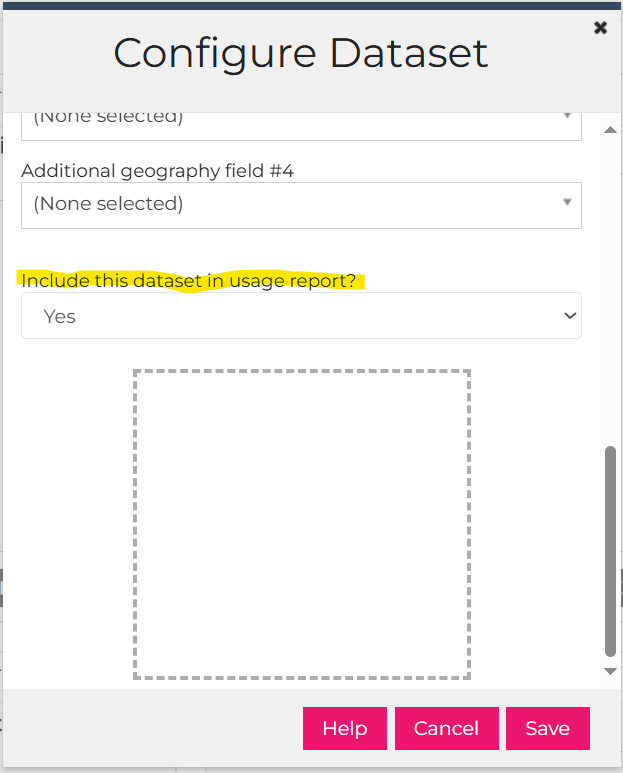
AIA Usage Report – Select Datasets to Include
The datasets to include in the AIA Usage Report can now be selected.
From the gear icon, Settings option for the dataset:
The dataset can be included or excluded from the Usage Report using the Include This Dataset in Usage Report option:
Copying Custom and Summary Tables
In Crosstabs, Custom and Summary tables can now be copied:
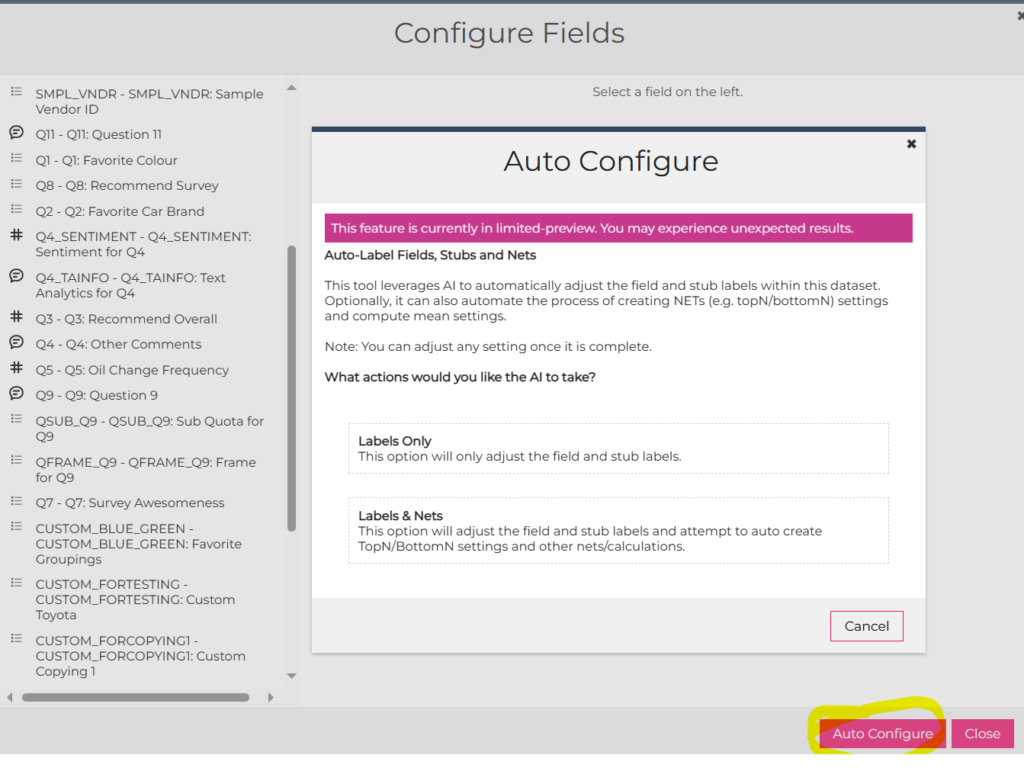
Auto Configure for Relabeling Fields/Stubs and Creating Nets
In Crosstabs, Dashboards, and the Query Tool, fields and stubs can now be relabeled using the new Auto Configure button rather than having to do this manually, field-by-field. On the Configure Fields dialog, the Auto Configure button launches the Auto Configure tool:
Reuse Query with another Survey
When a Query Tool has been set up on the PM Site, the column selections can be re-used in another query for a different survey. For similar surveys, this can reduce the effort needed to set up queries that involve a lot of fields. Please note that the only fields that can be copied from the source to the target survey are ones with matching names and data types.
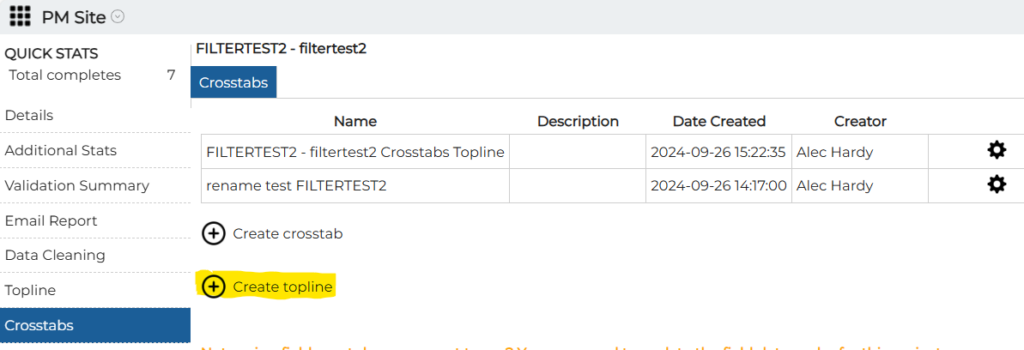
Topline in Crosstabs
The Topline can now be generated on the PM Site via Crosstabs.
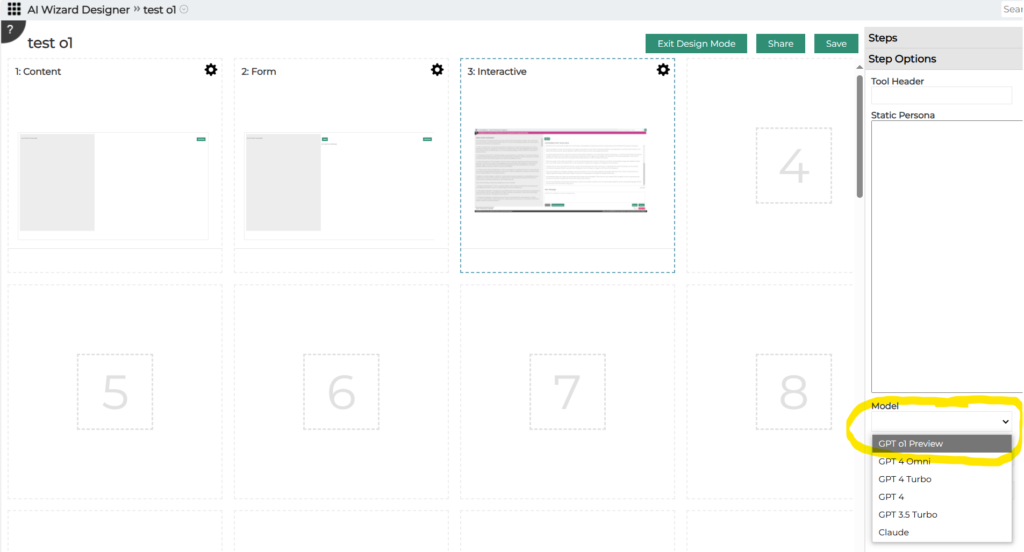
AI Workflow Wizard – OpenAI o1-preview Model
The new OpenAI o1-preview model can now be incorporated into AI wizards. This model features enhanced reasoning capabilities, improved accuracy in math, the ability to reason through tasks more logically and consistently, and improved performance in creative tasks.
When creating a new wizard using the AI Wizard Designer, the model can be selected on the Interactive step:
Resolved Issues
The following issues were resolved:
- In AI Workflows:
- An error with attaching a PowerPoint file to a chat was fixed.
- Long input to the AI are now displayed on multiple lines in the input box.
- An issue with displaying AIA topics in Crosstabs was fixed.
September 26, 2024
Highlights
Reverse Column Order in Crosstabs
CST Member Access to Client Research Cloud Items
Reminders to Update Field Cache
Standard Filters on the PM Site
Export Gold Sheets from PM Site
View Email Totals as Transmission is Occurring
Creating New User – Copying Permissions
Reverse Column Order in Crosstabs
The order of columns to use in a Crosstab can quickly be reversed using the new Reverse Column Order button. When a new column is included, it is added to the bottom of the list. This new button makes it easier to quickly move the new column to the top of the list.
CST Member Access to Client Research Cloud Items
CST users can now access items such as Dashboards, Crosstabs, Queries, etc that have been created by other CST users on client Research Clouds. Those items no longer need to be shared with other CST users for them to have access.
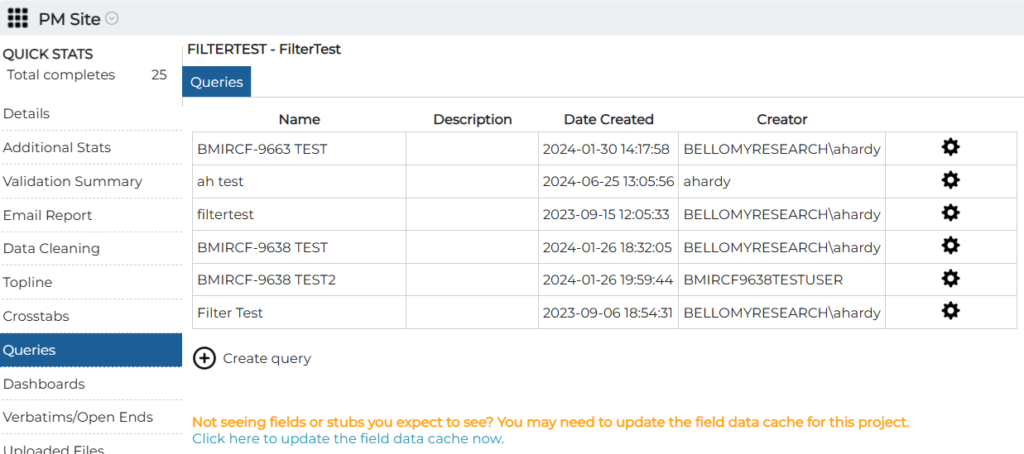
Reminders to Update Field Data Cache
Messages have been added to Crosstabs, Dashboards, and Queries lists on the PM Site to remind users to update the data field cache after changes have been made to the survey design. The data field cache temporarily stores information about a survey’s design to help the Research Cloud tools perform faster. After survey changes, the cache needs to be updated so that changes are available in the RC tools.
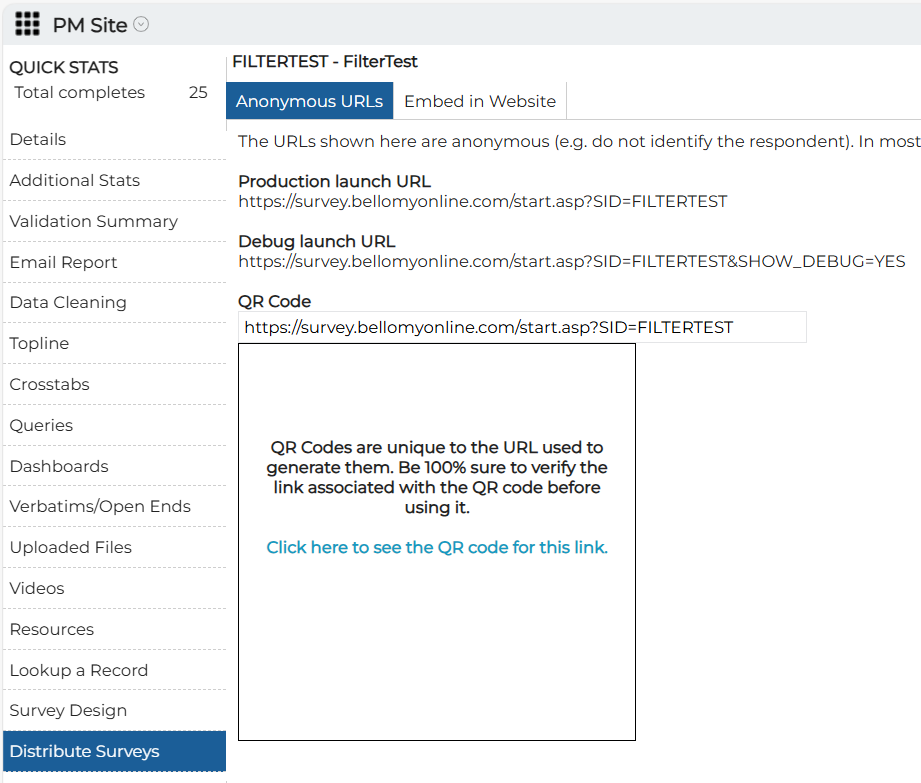
Survey QR Codes on PM Site
A message has been added to the PM site to remind users to verify QR codes before distributing them. A link has also been added to generate the QR Code.
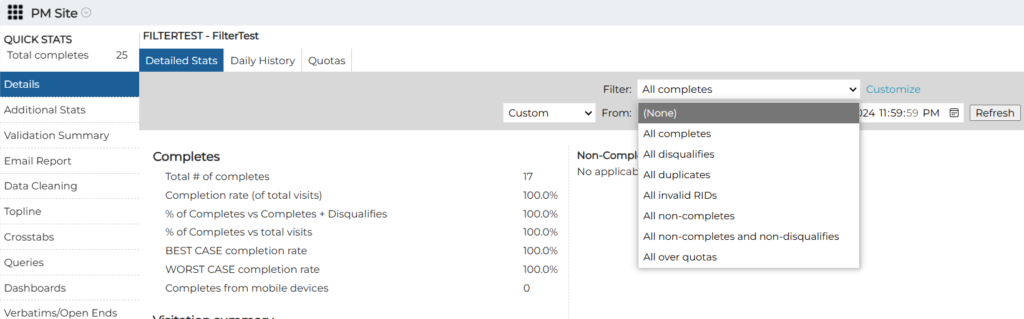
Standard Filters on the PM Site
Standard filters have been added to the PM Site. Please note that if custom filters have already been set up for an existing project, standard filters will not be available. Also, remember to hit the Refresh button after selecting a filter to update the data display.
Export Gold Sheets from PM Site
Gold Sheets can now be exported from the PM Site:
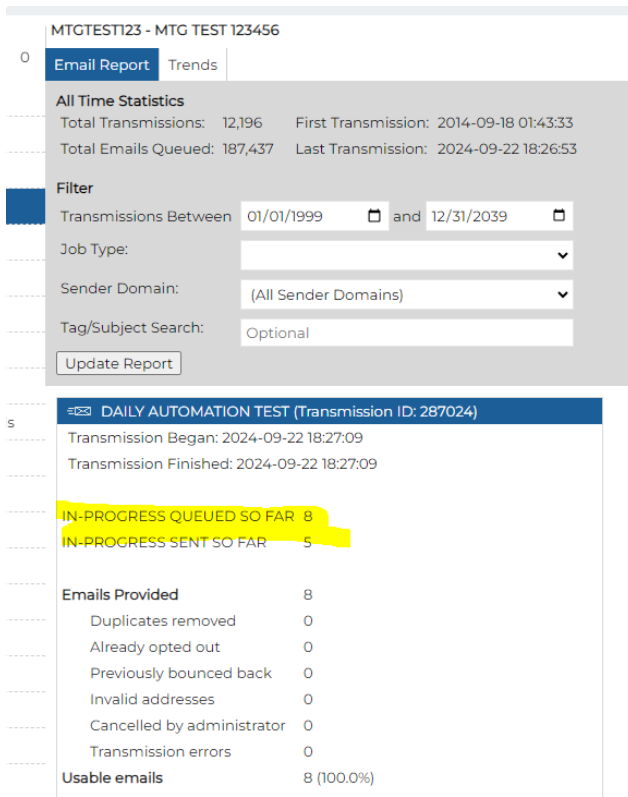
View Email Totals as Transmission is Occurring
The PM Site has been changed so email totals can now be viewed as the transmission is underway:
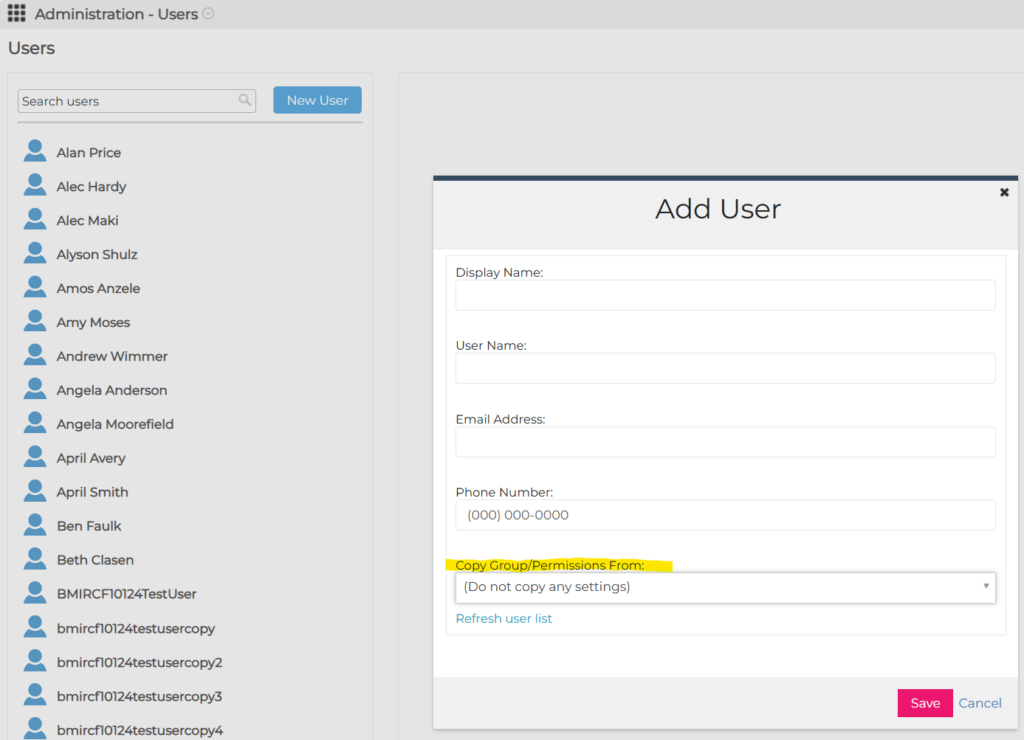
Creating New User – Copying Permissions
When a new user is being created, groups, permissions, custom properties, and event scripts can be copied from another user to make setup quicker.
Email.Manage Sorting
In the Email.Manage project on the PM Site, the output for several of the options was sorted to show most recent jobs first.
Resolved Issues
The following issues were resolved:
- In Crosstabs, stat testing letters were showing up in exports even though stat testing was turned off.
- When viewing video captures (on the PM Site, under Videos), the question number is now displayed with the question text in the drop-down that is used to select the question.
- When a video that was captured in a survey is deleted in the Videos section of the PM Site, it is also deleted on the client RC. Please note that the rest of the survey response is unchanged.
- When a new user is created on a Research Cloud, their phone number is now defaulted to zeroes so that the user can be activated.
September 19, 2024
Highlights
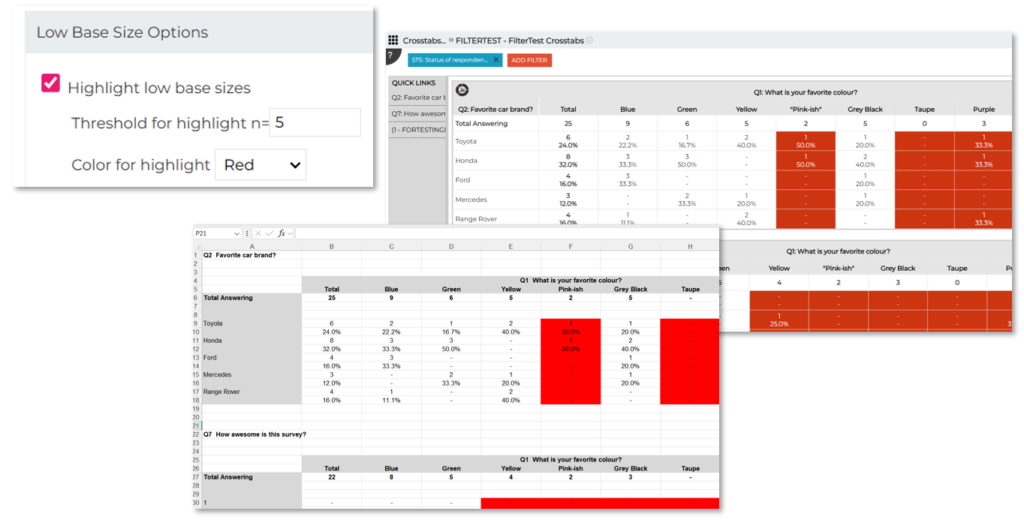
Low Base Sizes Highlighted in Excel Exports
Editing Column Headings in Query Tool
AIA Topic Modeler Can Now Use Longer Text
Dashboards Simple Crosstabs Widget – Mean with Base Size
Crosstabs Stat Testing for Means
Low Base Sizes Highlighted in Excel Exports
When low base sizes are highlighted in Crosstabs, those highlights are now included in Excel exports:
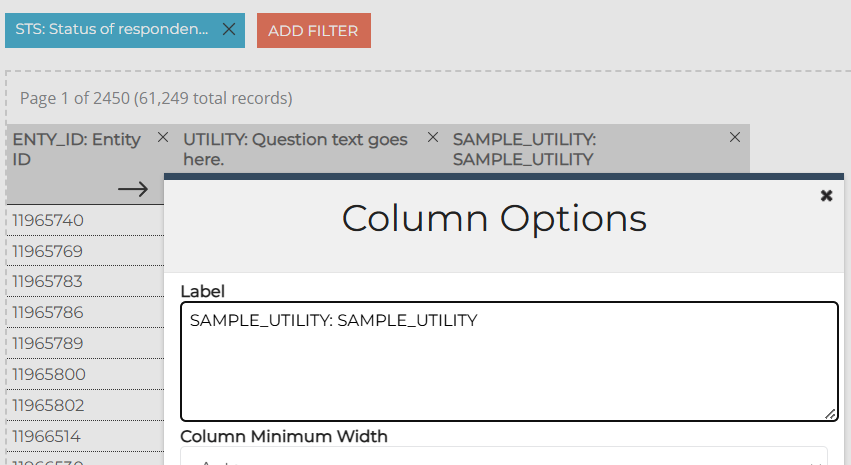
Editing Column Headings in Query Tool
It’s now easier to edit long column labels (headings) after a column has been added to a query. The label box can now be resized to make it easier to see/edit long labels:
AIA Topic Modeler Can Now Use Longer Text
The topic modeler in AI Analytics for Text is now able to process longer answers and transcripts. It was previously limited to using the first 450 characters of text in a response.
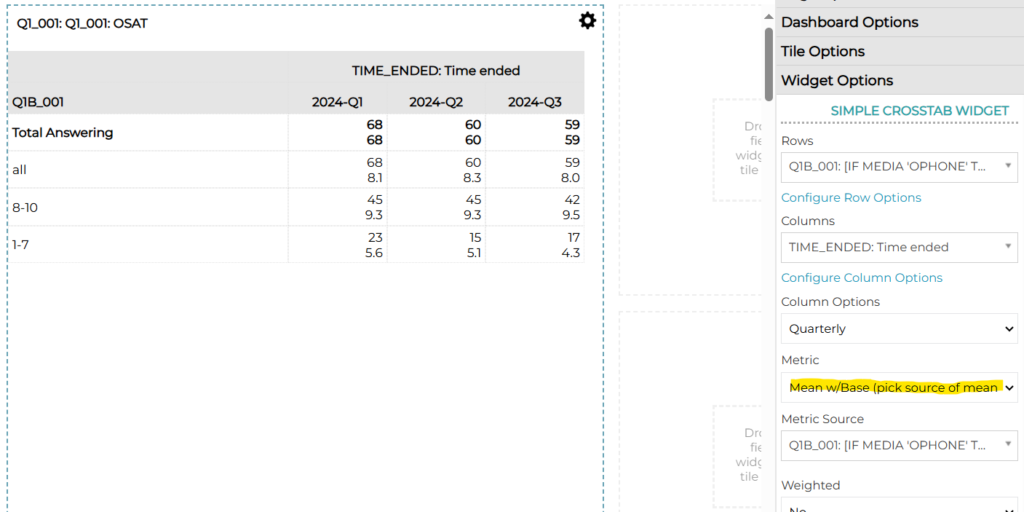
Dashboards Simple Crosstab Widget – Mean with Base Size
A new metric has been added to this widget so that the base size can be displayed with a mean value.
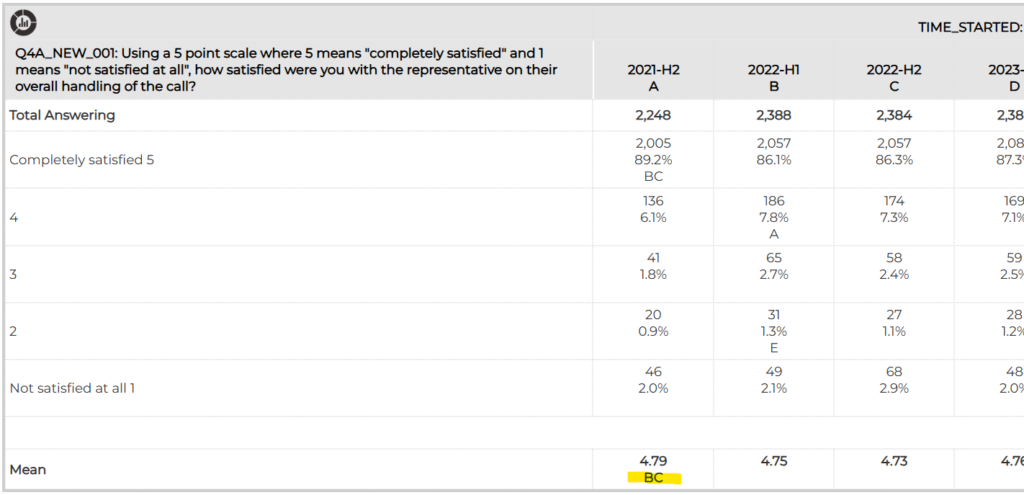
Crosstabs Stat Testing for Means
Stat testing can now be done on means.
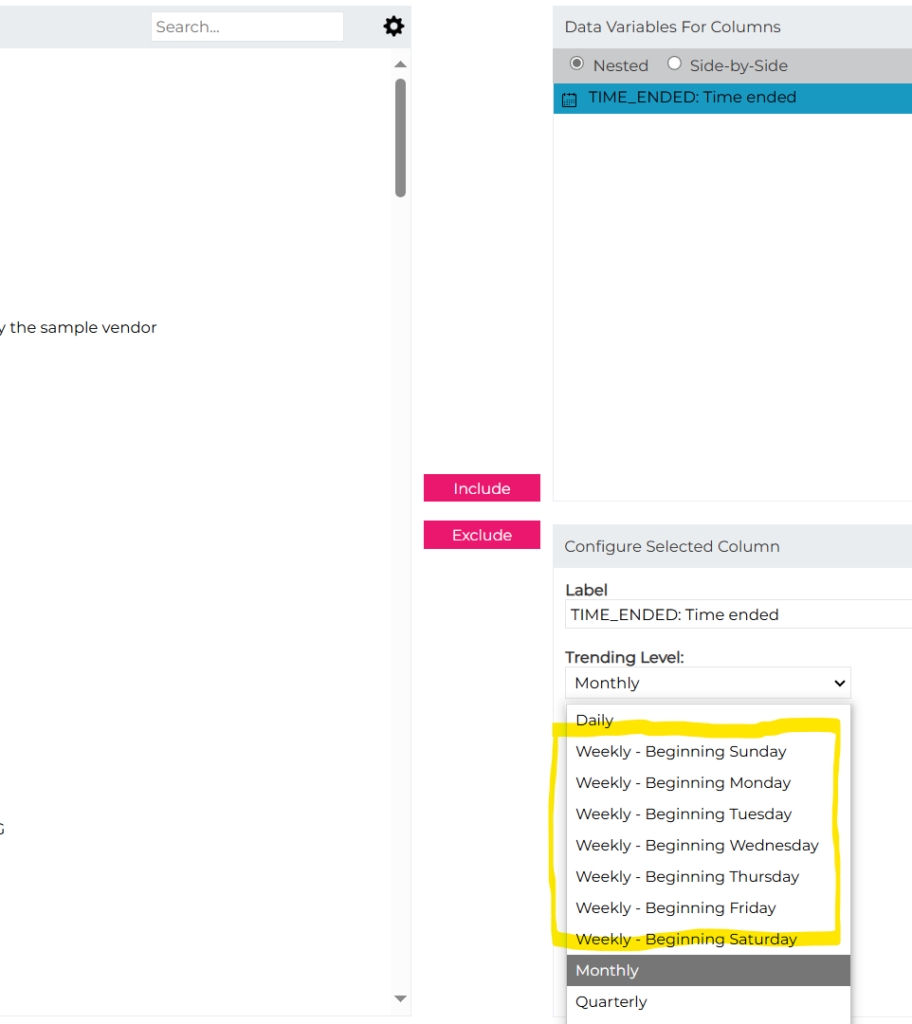
Weekly Report Trending
An option has been added to do weekly trending in Dashboards and Crosstabs. Because the beginning of the week varies by client, weekly options exist for each day of the week. Please note that this works for dashboards and crosstabs based on Bellomy surveys but not for other data sources such as AI Analytics datasets or cloud surveys.
In Dashboards:
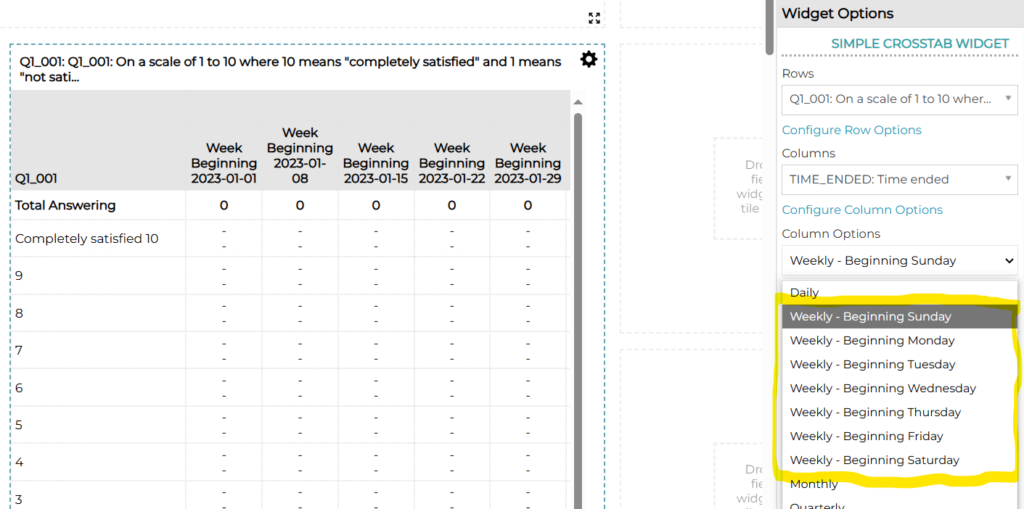
In Crosstabs:
Resolved Issues
The following issues were resolved:
- An issue was fixed on the Sharing\Share with People dialog which is used to share Insights Objects such as Crosstabs, Dashboards, Query Tools, or other site content. Before the fix, if someone’s name was selected for sharing but the user hit Cancel to get out of that screen without saving changes, the next time the screen was opened that name would show up again as having been selected for sharing. Please note that the object was never actually shared with that person, but this was fixed to avoid accidentally sharing it with them the next time this dialog was used.
- In Crosstabs, Excel exporting was fixed so that blank rows are no longer included where they are not needed.
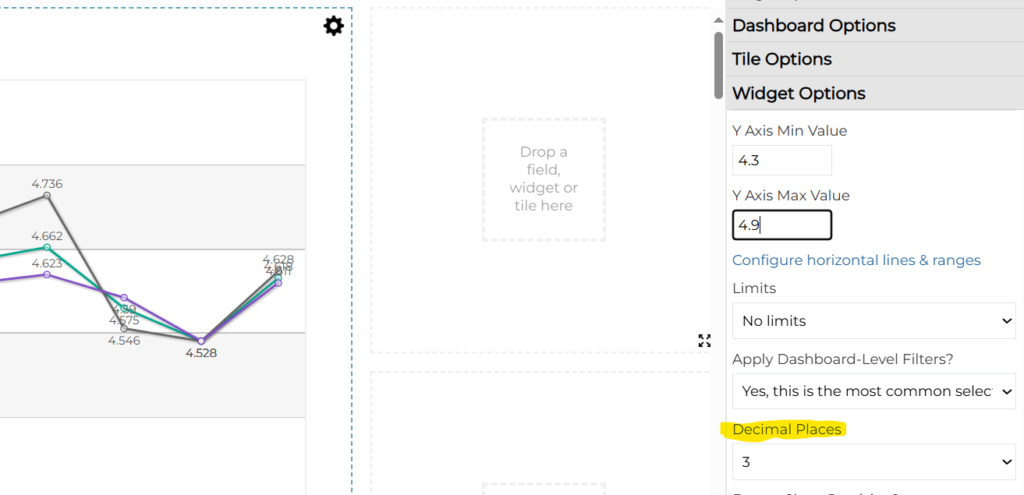
- In Dashboard line charts, mean values on the chart can now be displayed to up to three decimal places:
- Also in Dashboards, an issue was fixed where the wrong tile was being highlighted when a new widget was being dragged onto the dashboard.
September 5, 2024
Resolved Issues
The following issues were resolved:
- In Crosstabs:
- when the survey is joined to a table containing panel screener information, the screener fields were not showing in the Columns tab. This has been fixed.
- there was an issue with custom tables in nested columns. The custom tables’ results would not render – that has been fixed.
- an issue was fixed where stat testing column labels were being shifted in results exports.
August 29, 2024
Highlights
AI Analytics Survey Loader – Number Of/Most Important Topics
AI Analytics Survey Loader – Number Of/Most Important Topics
AI Analytics topic modeling can now be instructed to:
- only generate a certain number of topics.
- only assign the most important topic to a record
Resolved Issues
The following issues were resolved:
- After an AI Workflow has completed analyzing the inputs, re-analysis now occurs if the user hits the Analyze button again. For example, if an initial analysis was performed and the user wants to tweak the Additional Context instructions, they can make those changes and the Analyze button will cause the inputs to be re-analyzed from scratch.
- In AI Workflows, Generate Word Doc was failing to complete in some cases.
- In the Verbatims reports, an issue was fixed where net filters did not work if the left side of the page was set up to be filters-only.
- In the Status Report that can be created for surveys, an issue was fixed where CATI stats were not adjusting when a date filter was set.
August 22, 2024
Highlights
CATI Supervisor Chat Tool on new RC
AI Analytics Survey Loader – Refresh Data with Updates
Default Sort Order on Case Management Views
CATI Supervisors Chat Tool on new RC
The CATI Supervisor Chat Tool has been ported to the new RC.
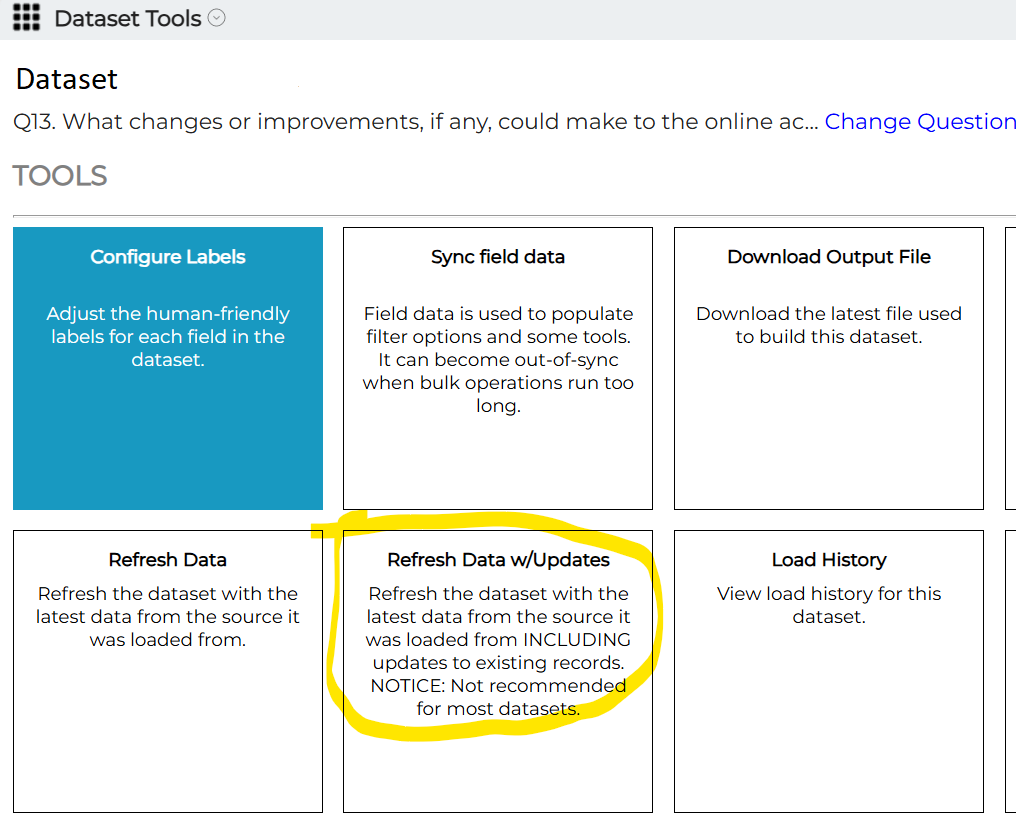
AI Analytics Survey Loader – Refresh Data with Updates
The Survey Loader can now add new records while updating changes made to records that were already loaded.
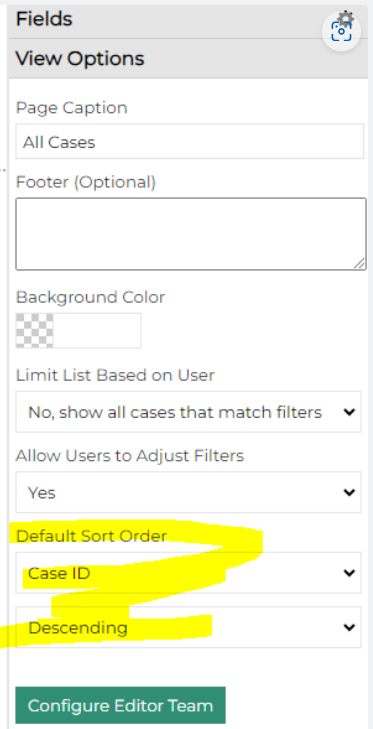
Default Sort Order on Case Management Views
Case Management can be configured to show cases in a pre-determined order:
Resolved Issues
The following issues were resolved:
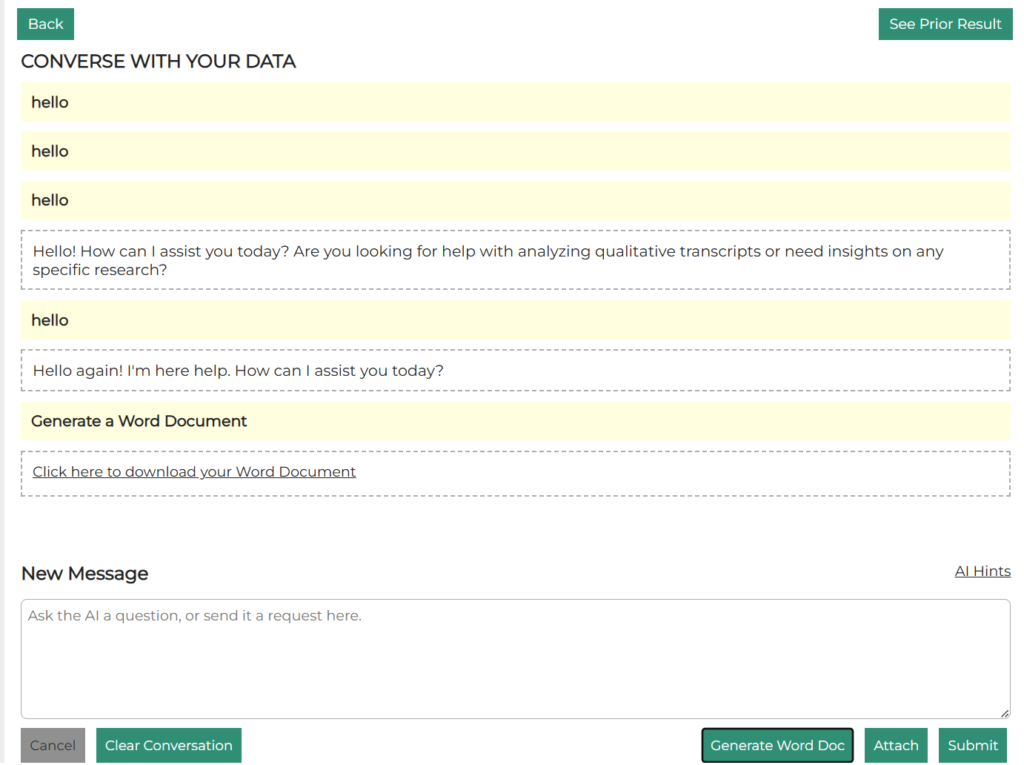
- In AI Workflows, after generating a Word doc, the chat scrolls to the bottom to make it easier to see that the document was created and to continue the conversation.
- In the AI Workflows Qual Analyzer, if the transcript that was uploaded was in a text file (rather than an MS Word doc), the Qual Analyzer would generate a large number of fields as a result of the analysis. This has been fixed.
- In Site Help, a problem was fixed that was preventing videos from being uploaded.
- In Text Analytics, an issue with selecting filters was fixed. Previously, if the user started to add a filter but clicked “X” to close without actually adding the filter, the next time they added a filter on a different field it used the original field that they had started to add a filter on.
August 15, 2024
Highlights
Reminder: Topline Retirement on September 1, 2024
Crosstab Exports to Separate Excel Tabs
AI Analytics Survey Loader Updates
AI Analytics Topic Descriptions Now in Exports
Reminder: Topline Retirement on September 1, 2024
As a reminder, the Topline report on the PM Site will be shut down on September 1rst. This is being retired because:
- The underlying technology that drives Topline will not be supported by Microsoft in the future. We cannot use out-of-support tech due to the security compliance agreements that we have with clients.
- The Crosstab tool can be used for the same type of reporting. It is important that we eliminate redundant tools to minimize the amount of effort that needs to be spent on maintaining existing capabilities.
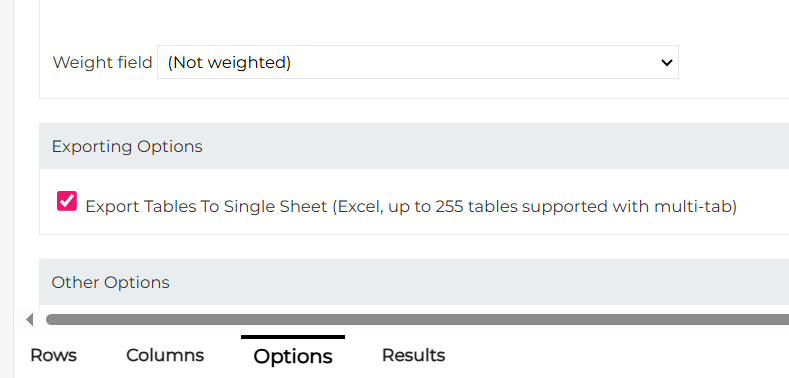
Crosstabs Exports to Separate Excel Tabs
Crosstabs exports to Excel have been enhanced so that you can decide if you want exports to appear on a single Excel tab or for each row to appear on its own tab. This can be set on the Options sub-tab of Crosstabs:
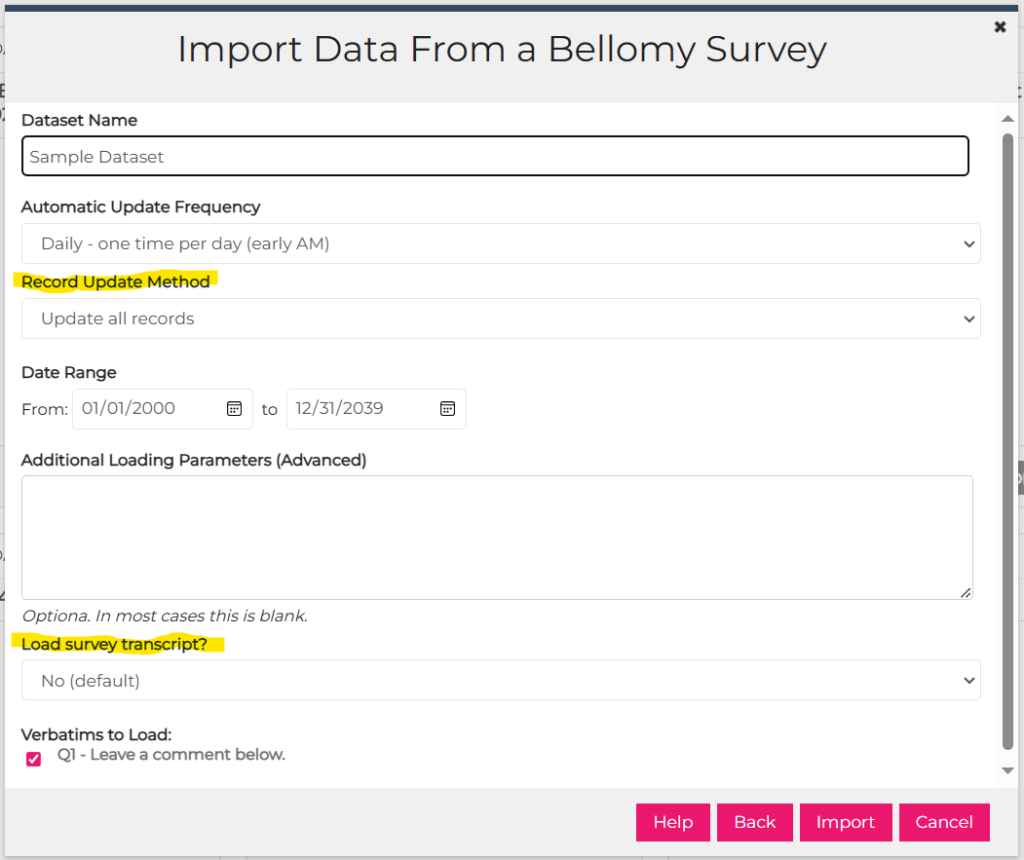
AI Analytics Survey Loader Updates
For Bellomy surveys, the Loader can now:
- re-load updated survey records (before, it could only add new records)
- load survey transcripts
AI Analytics – Topic Descriptions Now in Exports
Topic Descriptions are now included in term list exports:
Resolved Issues
- An issue was corrected that was preventing videos and other materials from being uploaded to Site Help in Research Clouds.
August 8, 2024
Resolved Issues
- In Crosstabs, an issue was corrected where “NaN%” was being displayed in place of percentage values (reported by Angela).
- An issue was corrected in Case Management where the wrong tier name was being displayed for some of the lower tiers.
August 1, 2024
Resolved Issues
- In the AI Workflows Qual Transcript Analyzer, an issue was fixed that was causing it to get stuck when loading content (reported by Rachel W).
- In Crosstabs, a bug with Editor Team functionality was fixed so that now only Editor Team members can save changes to a Crosstab.
- In the Query Tool, an issue was fixed with the ‘Show Field in Designer?’ setting so that fields with this set to ‘No’ don’t appear in the Fields pane on the right (reported by Steve N).
July 25, 2024
Resolved Issues
- In Crosstabs, an issue was corrected where the numbers in Excel exports were rounded differently from the numbers on the screen.
July 18, 2024
AI Workflows changes and fixes
- In simple chats, changes to the System Prompt are now saved.
- Chat workflows now handle long conversations. Previously, they could fail to process if the conversation was extensive.
- When a workflow that was previously on the chat screen is closed and re-opened, it shows the chat page when it is re-opened rather than having to step through the wizard again.
July 11, 2024
Highlights
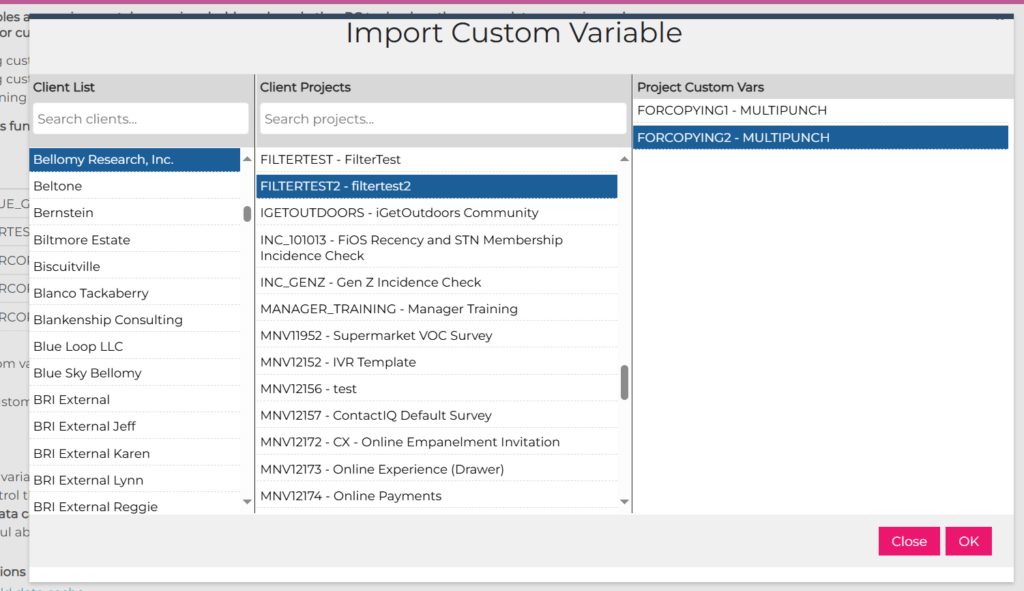
Copying Custom Variables From One Survey To Another
Reverting Field Customizations
Copying Custom Variables From One Survey To Another
Custom variables can now be copied from one survey to another. This is done by importing the custom variable from another survey. Please note that question numbers, filters, etc are copied over exactly as they were in the source survey, so if question or stub names/numbers are different they need to be edited after being copied.
To copy, select the client, the survey, and the custom variable:
Reverting Field Customizations
Changes that are made to a field’s information using the Configure Fields dialog can be undone using the new “Revert Customizations” button. This changes all of the field’s properties (field labels, stub labels, and other settings) back to their original values.
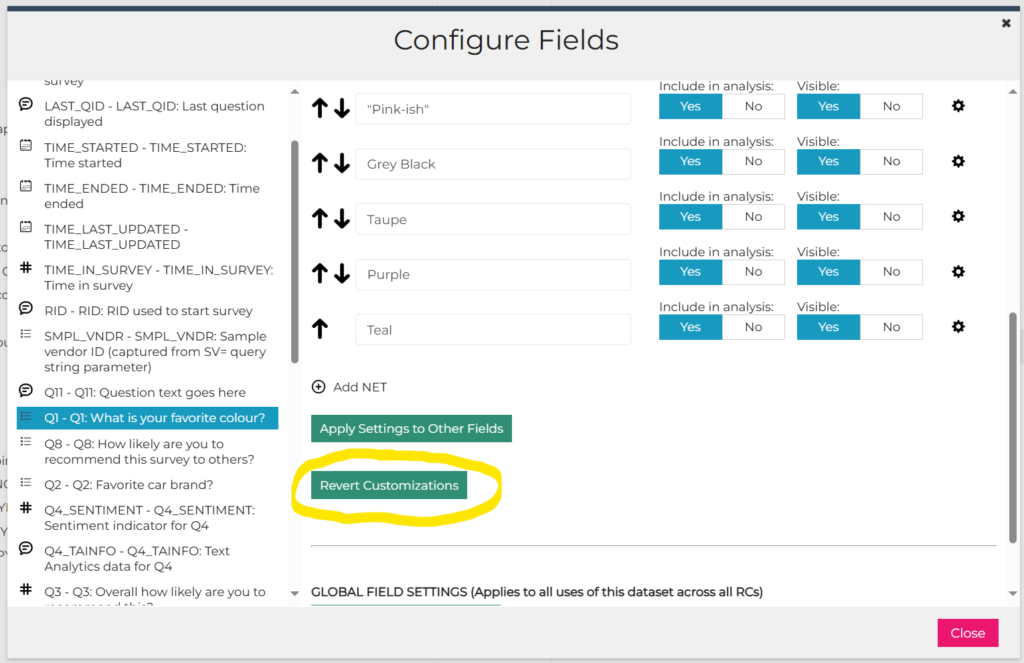
This can also be helpful in situations where custom variable changes for the survey are not showing up in a Crosstabs/Dashboard/etc after it was initially created. Field customizations that were made on Configure Fields sometimes prevent custom variable changes from showing up. Using the Revert button allows those custom variable changes to be brought into the Crosstab/Dashboard/etc.
June 27, 2024
Resolved Issues
AI Workflows:
- An issue was fixed in AI Workflows that was preventing a workflow from being re-opened.
- There was a problem with opening old workflows that had attachments (they would just show a blank screen). This has been fixed.
- A problem with saving Simple Chat workflows was fixed.
June 13, 2024
Highlights
Announcement: Topline Retirement on September 1, 2024
Stat Testing Within a Side-by-Side Column
Row-Level Proportions in Crosstabs
Announcement: Topline Retirement on September 1, 2024
The Topline report on the PM Site will be shut down on September 1rst. This is being retired because:
- The underlying technology that drives Topline will not be supported by Microsoft in the future. We cannot use out-of-support tech due to the security compliance agreements that we have with clients.
- The Crosstab tool can be used for the same type of reporting. It is important that we eliminate redundant tools to minimize the amount of effort that needs to be spent on maintaining existing capabilities.
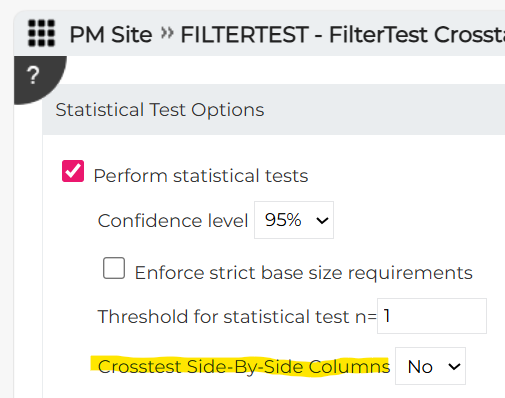
Stat Testing Within a Side-by-Side Column
With the initial release of side-by-columns in Crosstabs, stat testing was done across all columns (questions) on a row. With this week’s release, the user can now decide if they want to limit stat testing to occur within the values for given column (question) in a Crosstab. This can be set via the new crosstesting option:
Row-Level Proportions in Crosstabs
Proportions (percentages) displayed in Crosstabs were previously based on a cell’s proportion of the column’s total answering. Row-Level Proportions allows proportions to be calculated as a percentage of the row total. This can be set up on the Options sub-tab in Crosstabs:
Resolved Issues
Crosstabs:
- An issue was fixed where data was not displaying correctly for nested columns (reported by April).
- An issue with the base filter for individual stubs was corrected so that it uses that filter and not the one from the table’s base (reported by Kat).
- Proportions for nets for variables with floating base sizes (depending on whether the respondent saw the specific columns) are now calculated correctly (reported by Stephanie).
- PowerPoint exports for charts based on side-by-side column are no longer displayed as nested (reported by Sally).
- An issue with stat testing letters being added to Total columns in Excel exports were addressed (reported by Rachel).
- In certain cases, exports of a large number of tables were getting stuck and the resulting Excel output was incomplete. This has been fixed (reported by Kat and Mark).
- When attempting to share a Crosstab, in the Share with People dialog sometimes only groups were showing in the list to share with. This has been fixed so that both groups and individual users appear in the list.
- An issue where Standard Deviation and Standard Error weren’t being included in Excel exports was fixed (reported by Johnathan Loos).
June 6, 2024
Highlights
AI Analytics for Text – Combining Topics
AI Analytics for Text – Combining Topics
Topics can be combined in AI Analytics for Text by selecting them and right-clicking the Combine option. This feature was originally deployed at the end of March but was accidentally left out of the release notes.
Resolved Issues
DIY Surveys:
- An issue was corrected so that verbiage on form fields can now be updated (reported by Kerri).
- The Results sub-tab has been removed as it has been replaced by the new RC reporting toolset (Dashboards, Crosstabs).
May 30, 2024
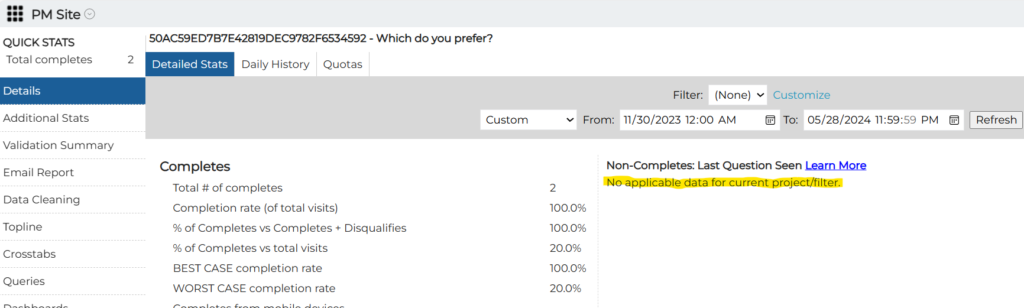
Message – No Data for Non-Completes
A message was added to the PM Site to let the user know when there is no data available for non-completes. Please also note that the previous verbiage “Points of Termination” was changed to “Non-Completes: Last Question Seen”.
May 23, 2024
Highlights
AI Analytics for Text – Filtering
AI Analytics for Text – Filtering
AI Analytics for Text records can now be filtered down to a single record using the record key:
View Question IDs
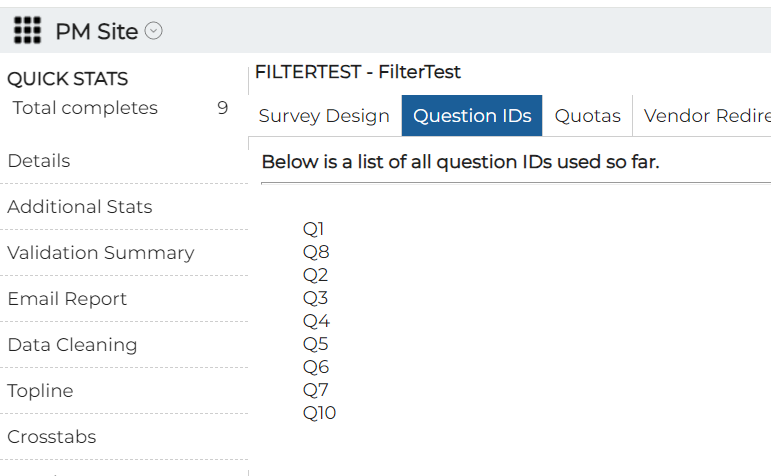
A tab has been added to the PM Site that lists question IDs. This will make it easier to ensure that questions IDs being added to an existing survey are unique:
May 16, 2024
Resolved Issues
AI Workflows:
- An issue was fixed in the Qual Analyzer so that text formatted as tables in the source transcript document is now used in the AI analysis.
Crosstabs/Query Tool/Dashboards – Configure Fields:
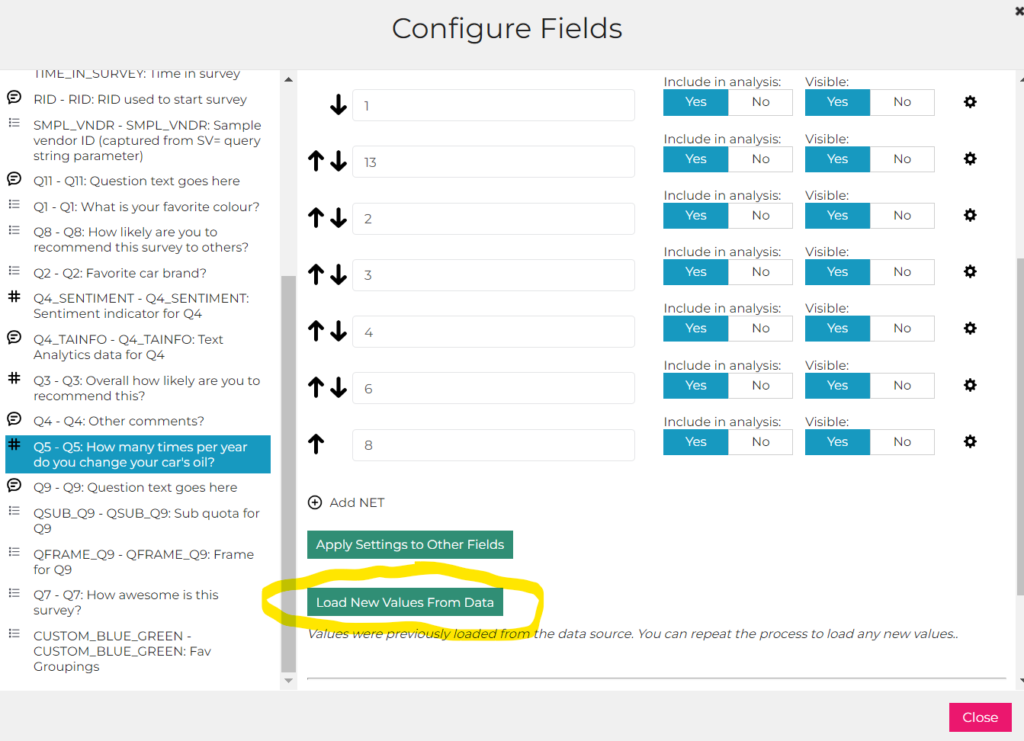
- When Load Values from Data was used to create stubs, the button was no longer available to load values from subsequent responses. A “Load New Values from Data” button was added to do this.
Crosstabs:
- An issue was fixed with custom table exports where they weren’t using the filters that were in place when Results were displayed.
- Issues were fixed with Crosstabs that use sample as the data source:
- Discrepancies with counts and columns being shifted.
- Inconsistent column orders across tables.
- Inconsistent base sizes.
PM Site:
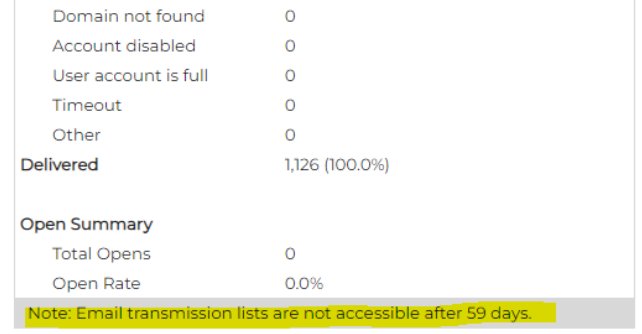
- A message was added to the Email Activity tab to inform the user that email transmission information is available for 59 days after the job (data for older jobs is purged from the system).
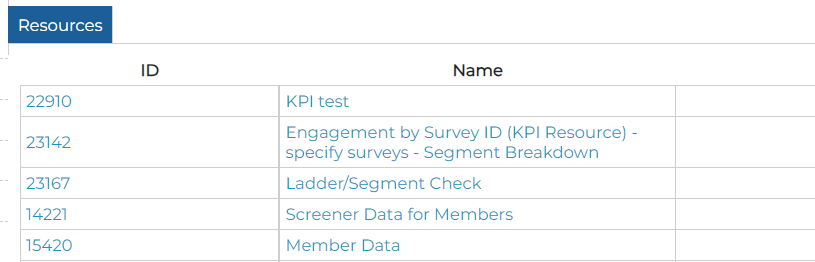
- The ID number of each Resource is now displayed on the Resources page.
- The Adjust Quota Sizes dialog (accessed from the Details section of the PM Site) was enhanced so that the column headers and row labels are still displayed when the user scrolls horizontally or vertically. This makes it easier to work on projects where there is a lot of quota info to display.
- Videos collected via a Video Upload question that was in a loop are now displayed on the Videos page in the PM Site.
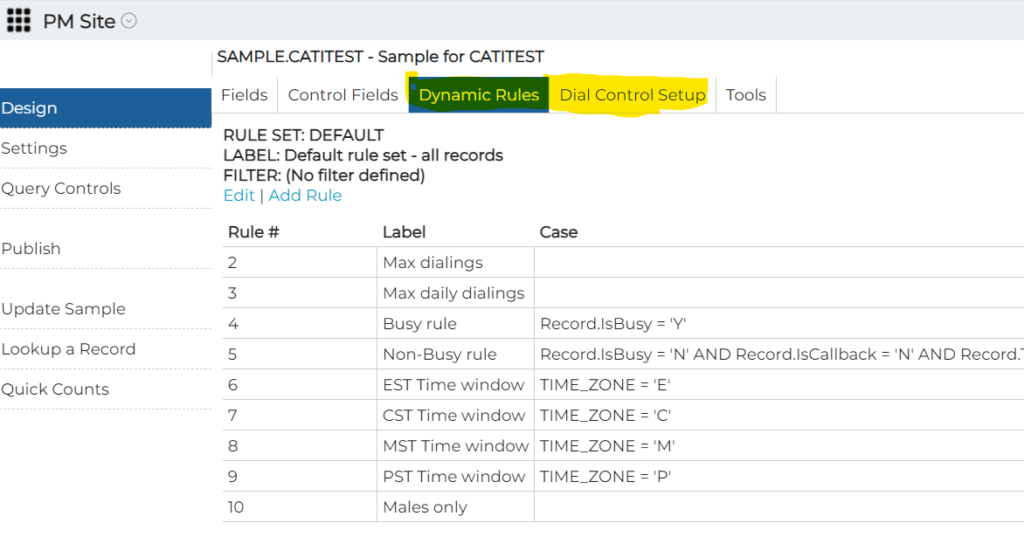
- The Dynamic Rules and Dial Controls Setup editors were not working – that was corrected.
AI Analytics for Text:
- An issue was corrected that was preventing users from adding variables to an AI Assistant query on the Terms page.
May 9, 2024
Highlights
AI Workflows Enhancements
The post-analysis conversation is now included in Word files that are generated.
New Survey Status Codes
The following survey status codes were added:
- OPTOUT
- RETIRED
- CHEATER
- SPEEDER
Resolved Issues
AI Workflows:
- When the user completes an AI Wizard and navigates through to the chat interface, when they navigate to another page then return to the wizard the chat interface is displayed rather than having to start from the beginning of the wizard again.
- The way that qual transcripts are fed to the AI, and the prompting used to analyze quotes were changed to make the results more accurate.
- An issue was corrected where plain text files were not being used by the Qual Analyzer.
- An issue that occurred when multiple files were dropped in the same place on the Qual Analyzer was fixed.
Crosstabs:
- An issue where proportions were not being displayed on the first row of Summary tables was fixed.
- Exports were failing for Crosstabs that contained side-by-side columns. That was fixed.
- Errors that were happening with Summary tables when an option was selected to show means, medians, Std. Dev., or Std. Err. have been addressed.
- Exports for Crosstabs that have a large number of Rows (tables) now include all of the tables and charts in PowerPoint exports.
- Clicking on the column header in Results now sorts the results.
- For Crosstabs created on the PM Site, issues with the export dialog box were fixed so that both Excel and PowerPoint options are available.
May 2, 2024
Highlights
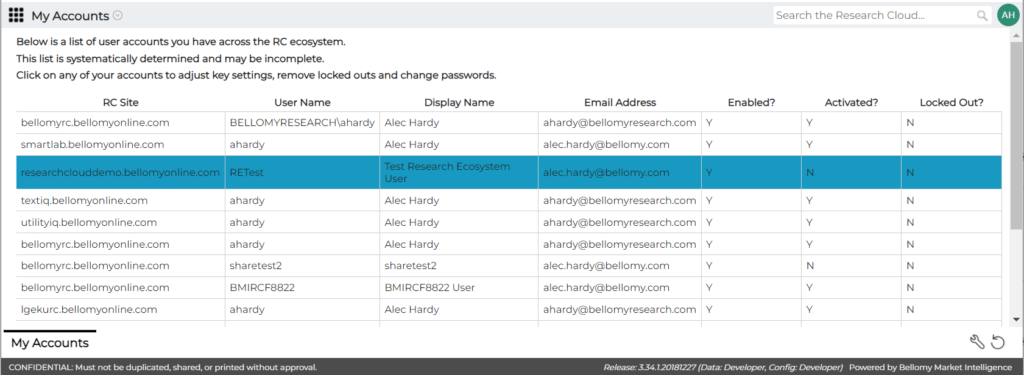
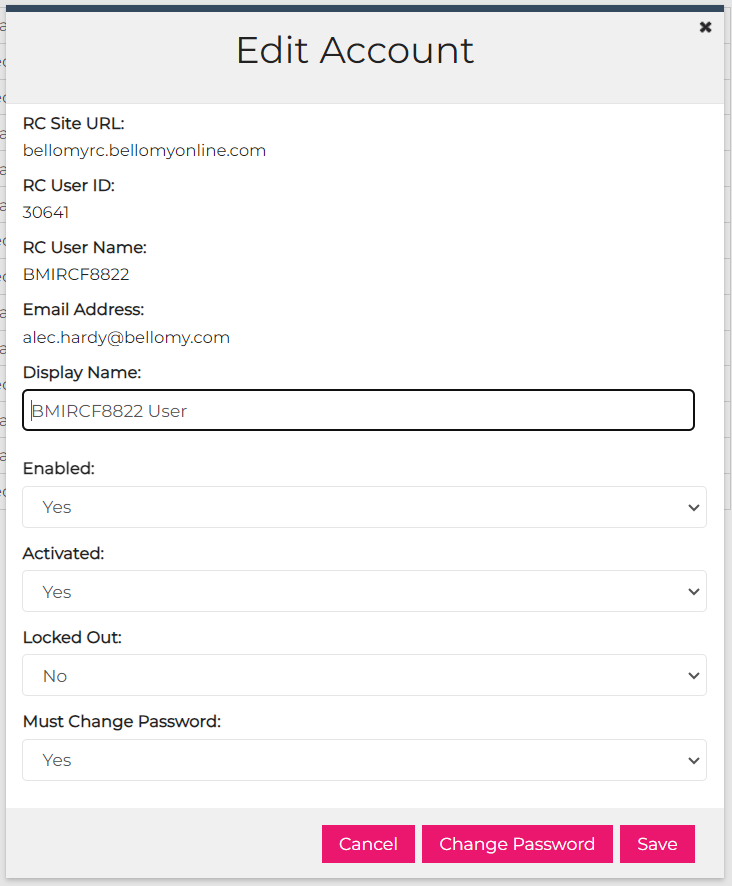
My Account – User Account Self-Service Administration
AI Workflows Enhancements
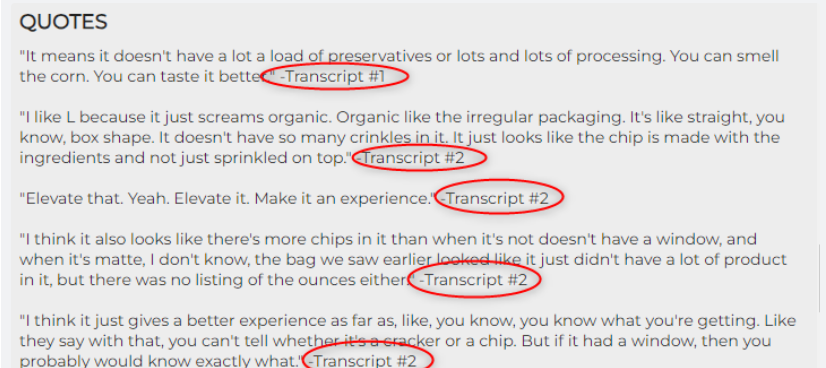
The transcripts from which quotes are pulled are now cited in Quotes (requested By Katie A):
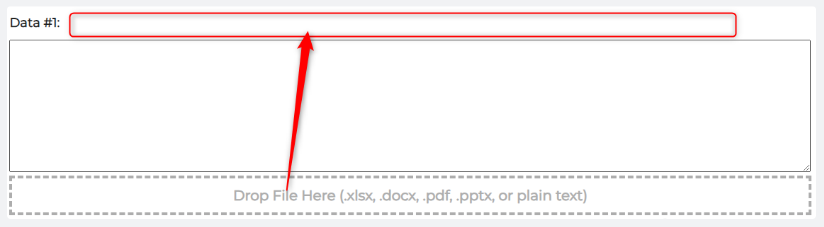
The dropped file name is now displayed (requested by Katie A):
My Account – User Account Self-Service Administration
On the Bellomy RC, the new My Accounts tool is available for Bellomy users to administer their own user login accounts:
Resolved Issues
AI Workflows:
- An issue was corrected where sometimes the AI was producing results in the summary that do not relate to the subject matter (e.g. it was including EcoBoost in SRP results, even though they do not have any products like that and there was no reference to it in the discussion guide). (reported by Katie A)
- On the AI Results screen, the conversation is no longer removed after downloading an MS Word document.
- Errors that were causing the SWOT Analyzer to fail were fixed.
April 25, 2024
Highlights
Email Rule Defaults
The following email rules are now added to new email jobs. This will help ensure that click tracking is enabled for all email jobs.
Resolved Issues
AI Workflows:
- An issue was corrected where the Qual Analyzer was sometimes returning errors when attempting to combine several executive summaries into a comprehensive executive summary.
- An issue with AI Workflows exports to PowerPoint was addressed by changing it so that exports can now be done to MS Word documents.
AI Analytics for Text:
- An issue was corrected where Sentiment was not showing up as a filter in some datasets.
- When the user runs Top Themes to create custom topics and then returns to History, it now properly shows as Top Themes not “Relevant Media Sites” (reported by Justin)
Crosstabs:
- In nets, blank response values will now be grouped under Not Specified (reported by Kat)
- An issue was fixed where the data in an export of a custom table was different from the custom table displayed in Results.
April 18, 2024
Highlights
Side-by-Side Columns in Crosstabs
Charts for Summary and Custom Tables in Crosstabs
Side-by-Side Columns in Crosstabs
Side-by-Side Columns are now available in Crosstabs!

Charts for Summary and Custom Tables in Crosstabs
When looking at Results for a Summary or Custom table, the data can now be charted. The same charting icon that appears for other tables in now available for Custom or Summary tables.
Resolved Issues
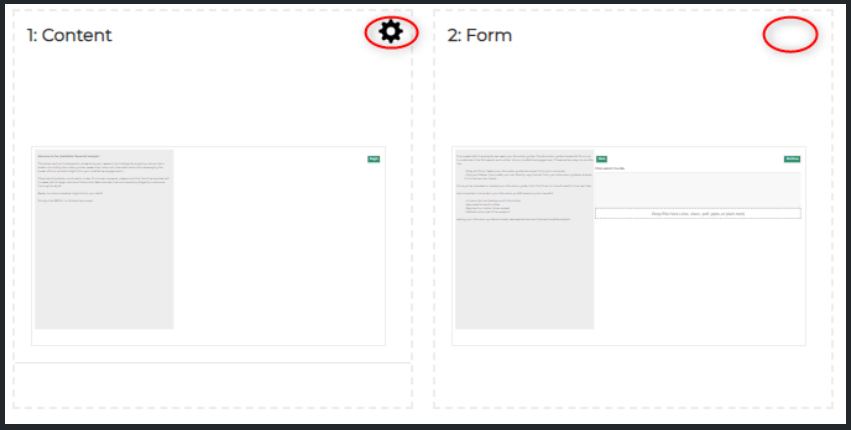
AI Wizard Designer: the Gear icon is now available on Form tiles.
PM Site: the Email Report was enhanced to better categorize some inbound bouncebacks as “Other” (reported by Kerri).
Crosstabs: various instances of column orders changing across tables in Results have been fixed.
April 11, 2024
Resolved Issues
Insights Objects: When a Dashboard, Crosstab, Query Tool, AIA Dataset or any other type of Insight Object is copied, the owner is now set to the person who copied it rather than the person who originally created the version being copied. The copier’s name is also visible on the card:
AI Wizards: AI Wizards can now only be edited by their owner.
April 4, 2024
Highlights
AI Analytics for Text – Custom Topics default
AI Analytics for Text – create Custom Topics from Themes
AI Translation Validation List export
AI Analytics for Text – Custom Topics default
Since AI custom topics are becoming more and more prevalent, when a new custom topic is created, it now defaults to “AI Assisted” instead of “Manual”. It also shows if a custom topic applies to all questions or the current question only.
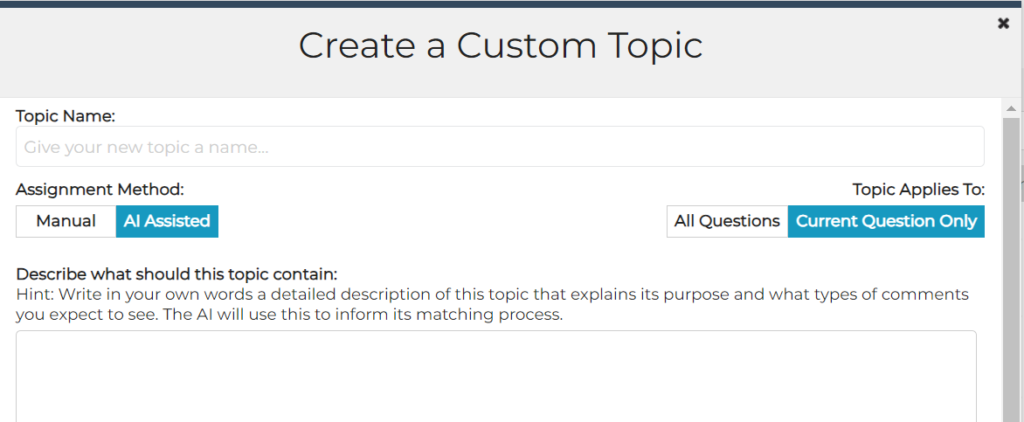
AI Analytics for Text – create Custom Topics from Themes
Custom topics can now be created from themes. After requesting the AI to identify the top themes:
The option to create a custom topic is provided for each theme:
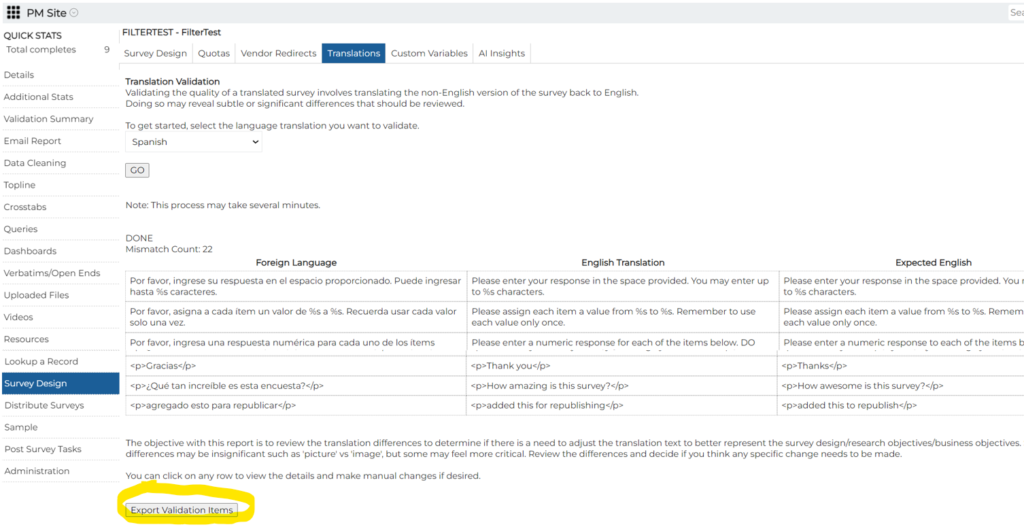
AI Translation Validation List export
The AI Translation Validation List can now be exported:
Resolved Issues
- On the PM Site, when trying to opt out a phone number that has already been opted out, a more friendly error message is now displayed (reported by Holly).
- In AI Workflows:
- In some instances where the user was in the middle of a long conversation with the AI, the AI would stop responding. This has been fixed.
- When there are several places on a screen where files can be dropped, an issue was fixed so that now the dropped files are associated with the correct place on the screen. Before this fix:
March 28, 2024
Highlights
Load New Values From Data in Configure Fields
AI Analytics for Text Loader for Amazon, Walmart, Target, and Home Depot reviews
Other AI Analytics for Text Changes
Custom Variables (Preview)
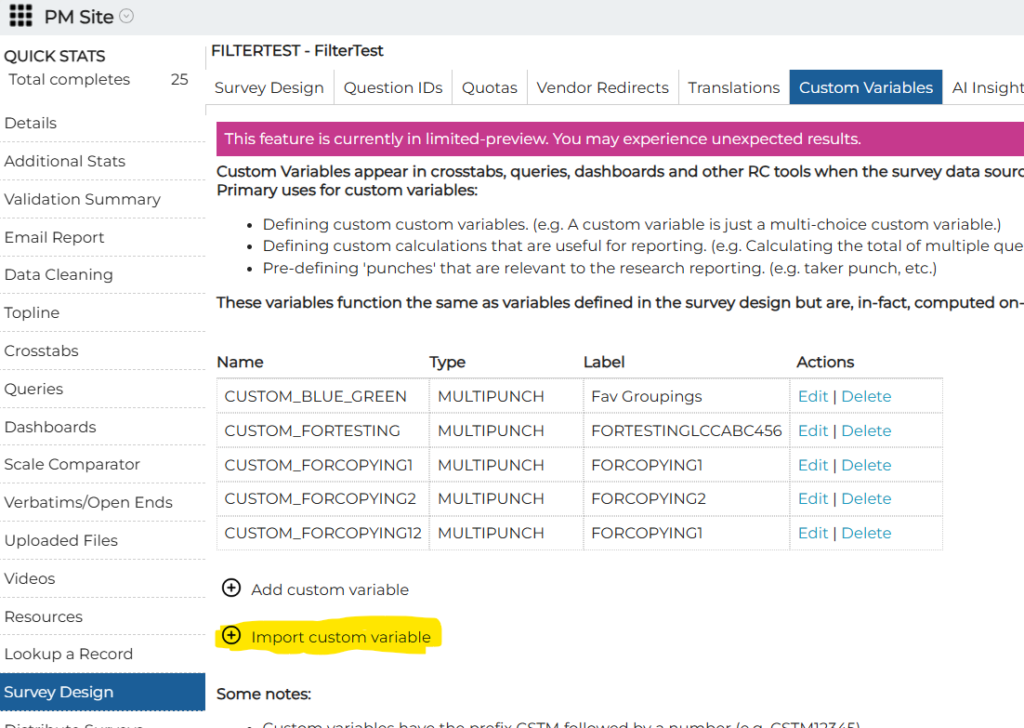
A new capability for defining custom variables (fields) in a survey for reporting purposes is now available for preview! This capability lets Bellomy users define things like custom banners, calculated fields, variables that combine data from several survey fields, and more. These custom variables are then available in Crosstabs, Query Tools, and Dashboards.
Custom Variables are defined in the Survey Design section of the PM Site:
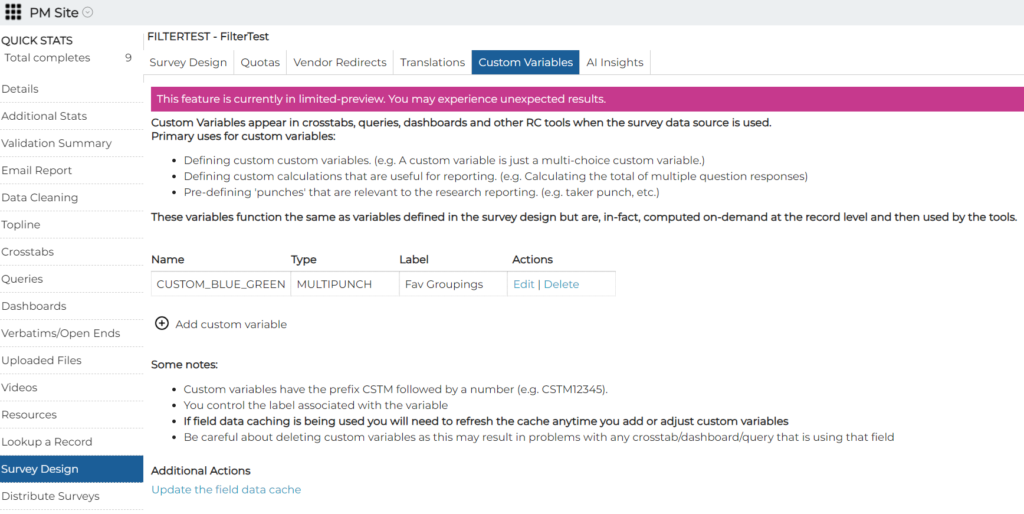
This capability is extremely versatile, and it’s also a little more complex than some of our other self-service capabilities. Please check out the Help info when you are creating or editing a custom variable, and don’t hesitate to reach out to TechFeedback with any questions.
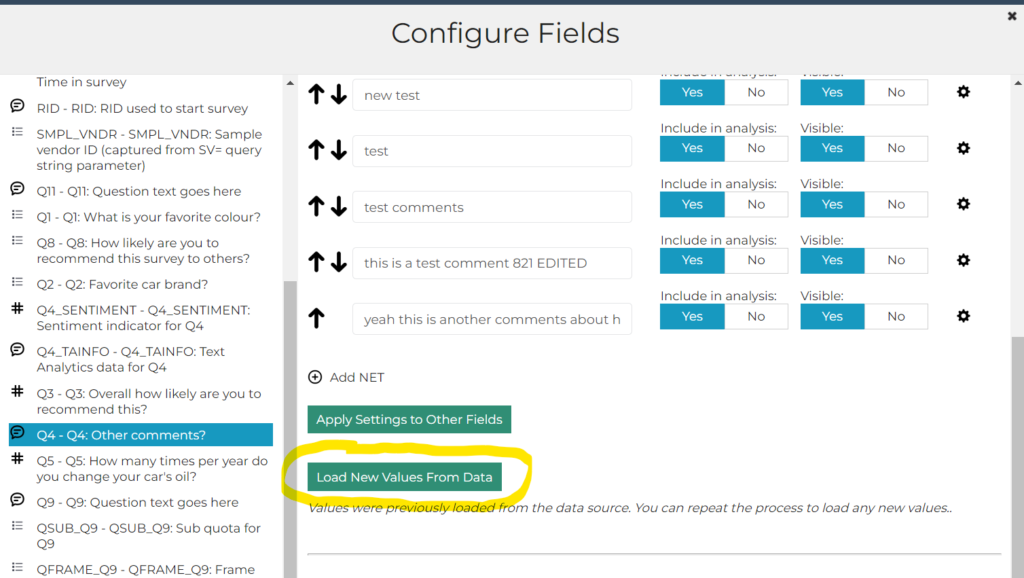
Load New Values from Data in Configure Fields
In Configure Fields (from the Gear icon at the top of Rows/Columns/Fields in Crosstabs/Dashboards/Query Tool), once the “Load Values from Data” button has been used to populate the list of stubs/values, a new “Load New Values from Data” button appears. This new button can be used to load additional stubs/values from data that was received after the initial setup was done. Please note that this option will only be available for new Crosstabs/Dashboards/Query Tools that were created after this release was made available. (requested by Elizabeth)
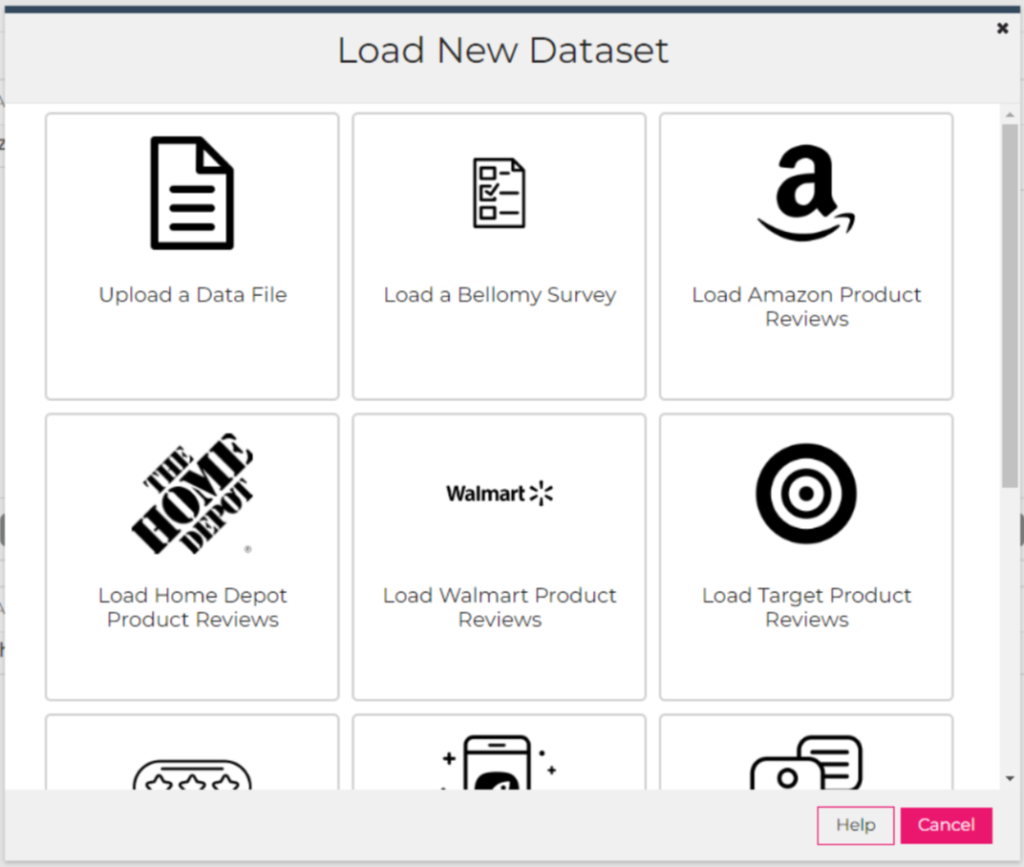
AI Analytics for Text Loader for Amazon, Walmart, Target and Home Deport reviews
Store reviews for Amazon, Walmart, Target, and Home Depot can now be loaded using the realtime AI Analytics for Text loader. Please note that this is available only to Bellomy users.
Other AI Analytics for Text Changes
- Labels on datasets cards have been changed to “AI Analytics Dataset” (instead of “Text Analytics Dataset”) to reflect the product’s new name.
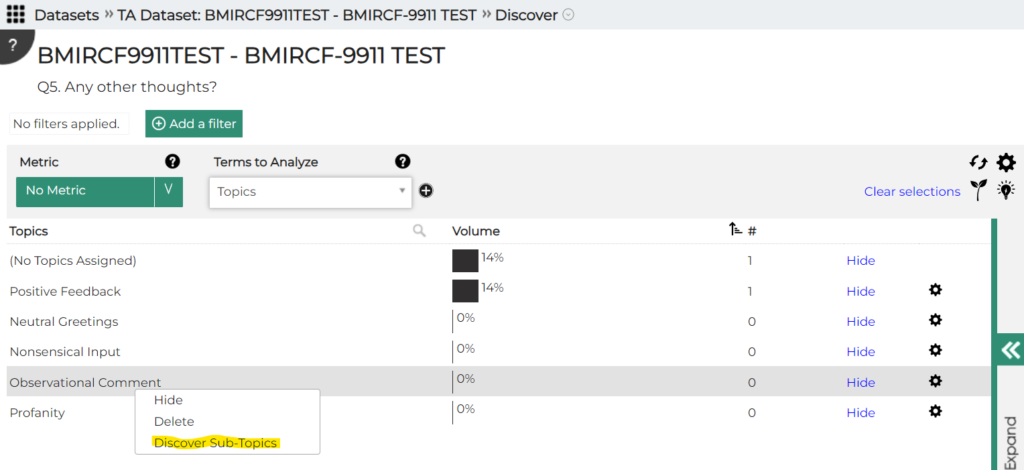
- Sub-topics can now be discovered by right clicking on a topic and using the new “Discover Sub-Topics” option:
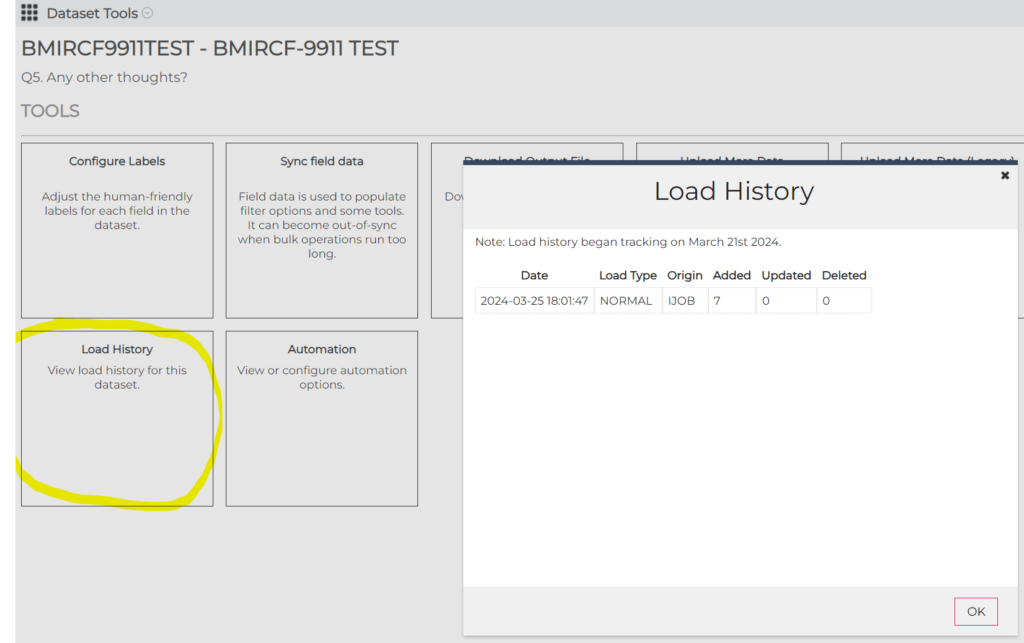
- For the Dataset Loader (under Dataset Tools), the load history can now be displayed. For now, this only works for surveys:
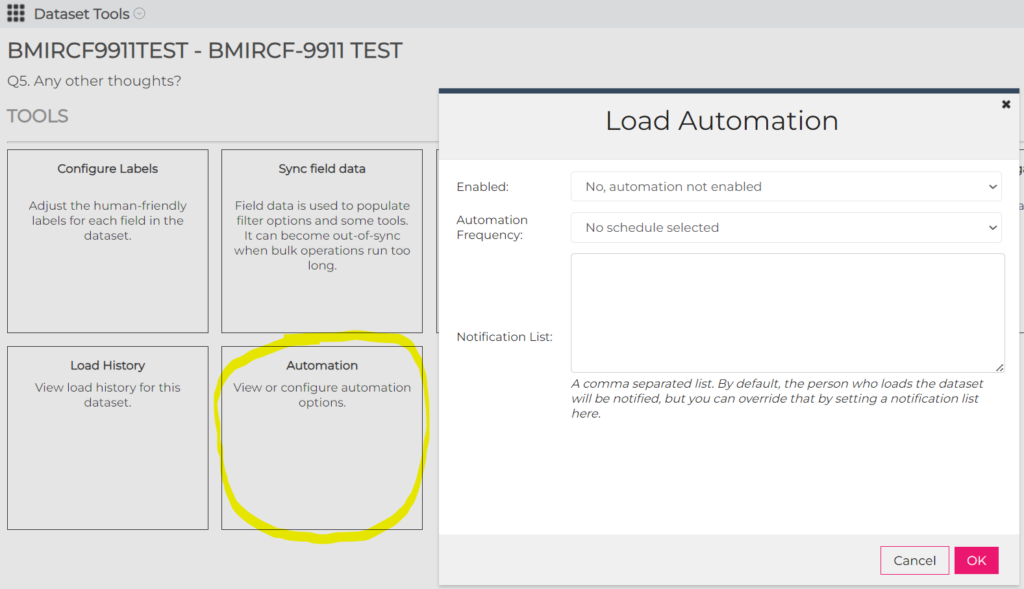
- Also for the Loader, loads can be automated so that new survey responses can be added to the dataset:
AI Workflows changes/fixes
An issue was fixed on the data collection screen on the Text Compare Analyzer so that all of the input fields are now visible.
Also, default values for input fields can now be specified in the Wizard Designer.
PM Site Changes
- The AI Insights capability was removed from the Verbatims/Open Ends tool on the PM Site. Instead, users will be directed to use the AI Analytics for Text tool to perform analysis on verbatims.
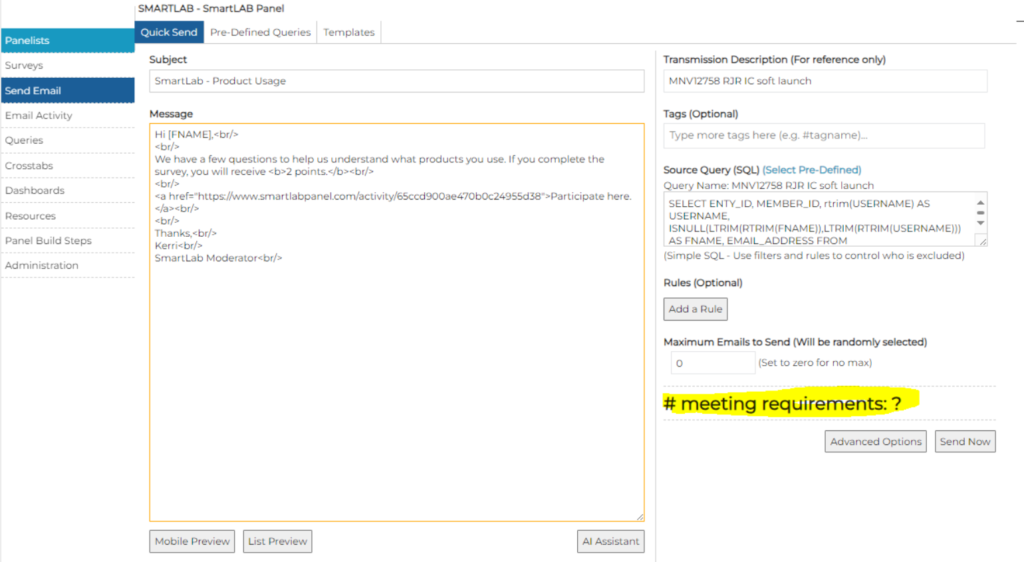
- On the Send Email – Quick Send screen, the number of panelists meeting requirements is now displayed:
- In Send Email, under Pre-Defined Queries, those queries can now be re-ordered in the list.
- As part of the new self-service Case Management solution, a page has been added to the PM Site for creating rules that drive case creation after a survey response has been received.
Resolved Issues
- An issue in the Query Tool Record Editor was fixed so that Codes fields can now be edited on smaller screens (reported by Chancellor)
- On the PM Site:
- In Resources, an issue was fixed where some columns in CSV exports contained blank data (reported by Ben)
- The email send process was streamlined to avoid having to click back and forth between so many screens (requested by Lindsey)
- On the email transmit screen, the “Cancel – Do not transmit” button no longer changes to “Transmission Complete” after it’s clicked.
- In Crosstabs:
- When joining to a panel data source, you don’t have to log off of the RC or refresh your browser any more to see the joined panel fields.
- For surveys that contain single instance loops (e.g. to extend the number of survey fields available), the display of fields in the rows and columns lists has been cleaned up.
March 21, 2024
Resolved Issues
In AI Workflows:
- For surveys that contain single instance loops (e.g. to extend the number of survey fields available), the display of fields in the rows and columns lists has been cleaned up.
- An issue in the Bulk Text Analyzer was fixed so that uploaded text is available for analysis by the AI.
- The AI Wizard Designer was enhanced to always automatically advance to the next processing step rather than providing an option for doing that. Also, “Section Options” was renamed to “Input Field Options” to be more intuitive.
On the PM Site:
- An issue where the list of the Crosstabs was being displayed in a different order every 10 seconds was fixed. (reported by Sally)
- An issue on the Send Email – Quick Send page was fixed so that the Maximum Emails to Send are no longer set to NaN. (reported by Kerri)
- When a duplicate phone number from gold sheets for a CATI project is entered, a more user-friendly error message is now displayed. (reported by Holly)
- An “undefined” message resulting from an email rule was fixed (reported by Lindsey)
In the Query Tool:
- Exports that contain a large number of records no longer fail.
March 14, 2024
Resolved Issues
In AI Analytics for Text:
- Filtering on Text Length or Word Count didn’t always work for records loaded with the real-time loader. This has been fixed
- An issue was fixed so that emerging topics are now prefixed with “(E)”.
- The topic modeler was sometimes failing on Step 4. This has been fixed.
March 7, 2024
Highlights
AI Analytics for Text – Data Refresh
AI Analytics for Text Data Refresh
AI Analytics for Text datasets that were created from Bellomy surveys can now be updated with new survey responses that were received after the data was initially loaded. The ‘Refresh Data’ option has been added to Dataset Tools:
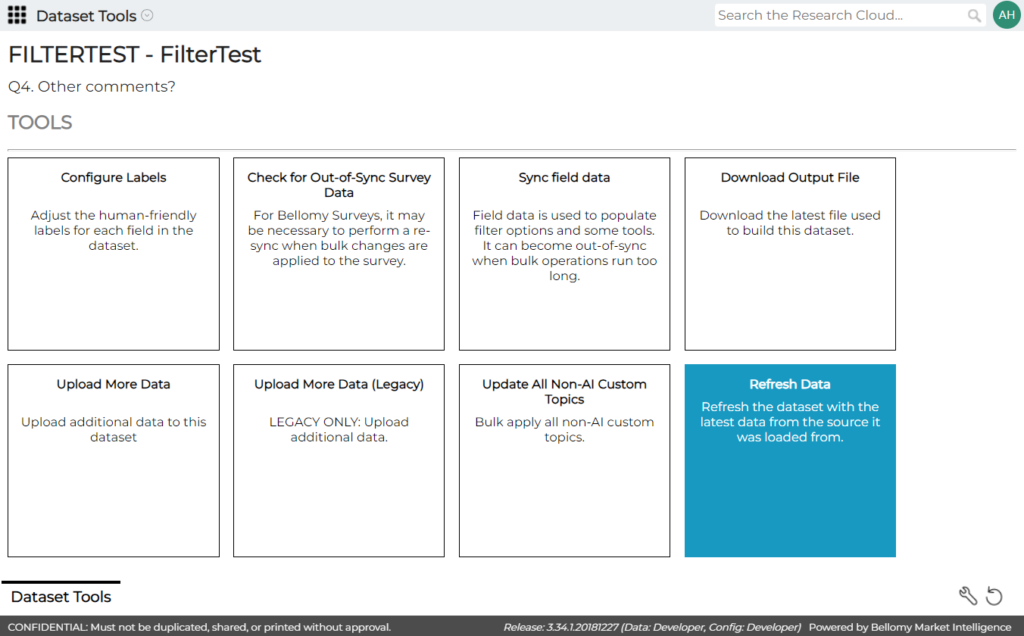
Note that only new survey records will be added to the existing dataset on a refresh. Any survey records that were previously loaded into the dataset and then changed (e.g. their statuses were updated) are not updated in the dataset by a refresh.
AI Workflows enhancements
A couple of things were changed with AI Workflows:
- The Export button is now disabled until the user is on the results screen where the user can prompt the AI with questions
- The message that the system is busy querying the AI has been made more prominent.
Resolved Issues
- The following issues were resolved in the Query Tool:
- In the Record Editor, a bug was corrected so that CODES fields can now be updated.
- Text Analytics topic names are now correctly displayed.
- Multiple choice field names from text analytics datasets are now displayed correctly in the column headers.
- In the Qual Transcript Analyzer:
- The “X” icon on the Transcripts screen was not working, so a transcript could not be deleted. This was fixed.
- The chat interface was fixed so that if you ask for quotes from attached transcripts, it now returns quotes.
- In AI Analytics for Text:
- Exports from the Comparison tab were fixed so that the differences are exported correctly.
- Exports from the Discovery tool were failing – this was fixed.
- Deleted topics are no longer visible in some tools such as when adding or removing topics in bulk.
February 29, 2024
Highlights
AI-enabled survey translations
AI Analytics for Text improvements
AI-enabled survey translations
The survey translation tool has been updated to use AI tech to translate survey questions and controls to other languages. The translation tool is available in the Survey Design section of the PM Site:
Options exist to:
- Automatically translate from one language to another using AI.
- Export the translations, perhaps for review by the client.
- Import translations.
- Validate translations via reverse-translation. This translates the non-English version of the survey back to English to look for obvious or not-so-obvious discrepancies from the original translation that should be reviewed.
Please note that the RIS will have to put special programming in the survey to use any language translations that have been created.
Qual Analyzer Improvements
The following improvements have been made to the Qual Analyzer:
- A progress bar is displayed when multiple files are dropped at a time.
- The “Continue” button is disabled when multiple files are being processed
- Dropped files are processed in the order in which they were dropped.
- The display is updated correctly when one of several dropped files is deleted.
- Note that only a portion of the discussion guide is now displayed on the screen after its file has been dropped.
- A few other bugs were also fixed:
- the chat interface was fixed so that the analyzer responds correctly when the user asks for quotes from chat transcripts.
- when a file is attached for use in a chat session, when the user navigates elsewhere in the RC and then comes back to that chat, the chat now remembers that the file was attached so that it is used in subsequent requests from the user.
AI Analytics for Text Improvements
The following improvements were made:
- Filter options were added to eliminate blank records from analysis
- This can be done via a link at the bottom of the term list
- Or, this can be done with a filter on the length of the text
- This can be done via a link at the bottom of the term list
- Several items in the term list can now be selected at a time by using CTRL+Click. Individual items can also be de-selected using CTRL+Click:
- The “Coding” navigation option is being removed from AI Analytics for Text as coding will be done via the new Coder on the PM Site.
- A few bugs were also fixed:
- When there were “(No Topics Assigned)” to certain items, and topics are then assigned to them, “(No Topics Assigned)” now disappears.
- Newly created custom topics now appear in the filter list without having to exit/re-open the dataset.

Add/Edit Client Records
RISs can now add or edit client records on the PM Site. Please note that records cannot be deleted.
Resolved Issues
The following issues were resolved:
- In Dashboards, the Summary Table widget was corrected so that it properly displays weighted data to three decimal places.
- The Delete function was not working correctly on Quota Reports. This has been fixed. Note that this function removes the quota from that quota report (e.g. on the client RC), but not from the survey itself.
- System errors were reported when generating Toplines and sending emails on the PM Site. Some changes were made to reduce the likelihood of these occurring, but there are some fundamental technical limitations of our current survey system that may cause these to occur from time to time.
- Under Surveys, the “+ Link” button was removed from Research Clouds since it is obsolete.
- A Crosstab that uses a Text Analytics dataset can now be re-opened without getting stuck.
February 22, 2024
Highlights
Percentages on dashboard Summary Table widget
Percentages on dashboard Summary Table widget
A new option has been added to the Summary Table widget in Dashboards. The widget can now be set up to only show percentages. This can be helpful when the variety of questions in the tables is such that showing the counts could cause user confusion e.g. when there are significantly different base sizes for each question.
One additional note: The “Count/Percentage” option shown above used to be called “Count/Frequency”. It was renamed to “Count/Percentage” to be less ambiguous.
Resolved Issues
- The following issues were resolved:
- A PM Site issue was fixed where a new email job could not be created without importing. (reported by Johnathan H).
- Excel exports that were failing in certain situations in Crosstabs were fixed.
- In Crosstabs, when “Show frequencies” was not chosen as an option, frequencies were still being displayed in Custom and Summary tables. This has been fixed.
- In Text Analytics:
- exporting datasets no longer produces an error, and
- the AI topic modeler was tweaked to that it does not over-assign topics to very short text.
- The AI Workflows Qual Analyzer was fixed so that it does not produce errors when multiple transcripts are present.
February 15, 2024
Highlights
Resolved Issues
- The following issues were resolved:
- An issue with AI Workflows was corrected so that errors are not displayed any more when a chat with an attached file is closed and re-opened several times.
- In AI Workflows, errors when URLs are attached to simple chats were fixed.
- AI Workflows was fixed to properly understand if the user asks about what is in an attached file.
- A PM Site issue was fixed where a new email job could not be created without importing. (reported by Johnathan H).
February 8, 2024
Highlights
AI Analytics for Text – Topic and Recommendation Wizards
New Research Cloud Header
The RC header has been updated to be more compact. This is in response to feedback from users who are using smaller screens so that less real estate is taken up by graphics, navigation, and the search bar.
AI Analytics for Text – Topic and Recommendation Wizards
The Topic and Recommendation wizards now require the user to decide which questions should be used and whether they want to add new topics or remove existing topics. Previously, these wizards defaulted to modeling all questions, which required extra processing time and effort.
Easier Way to Add Email Seeds
When creating email jobs on the PM Site, you can now add multiple email seeds more easily. (suggested by Philip S).
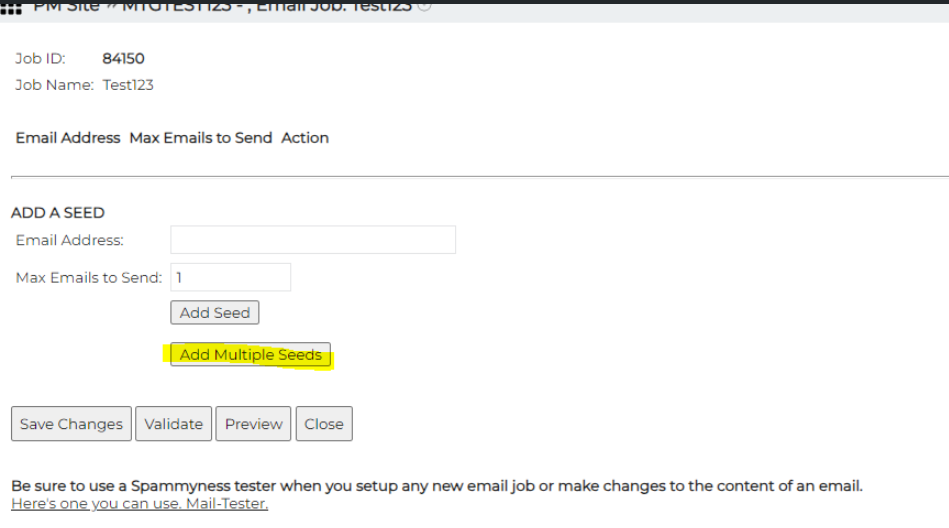
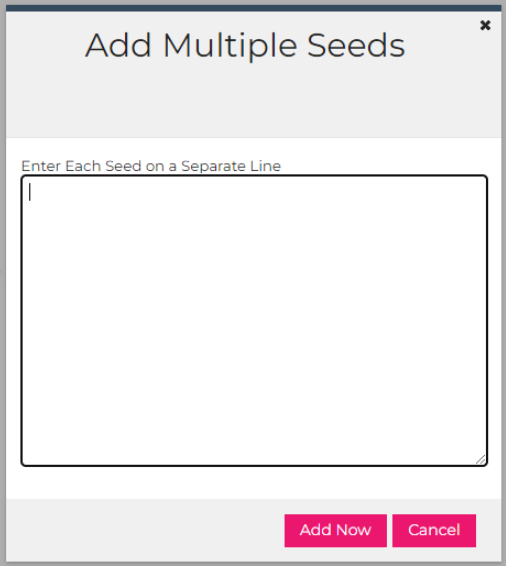
AI Workflows enhancements
The ‘See Prior Result’ button appears in the Bulk Text Analyzer to make previous chats available.
Resolved Issues
- The following PM Site issues were resolved:
- When a quota contains multiple logic conditions, each of the conditions in now tested when “Test Survey & Sample Cases” is hit. (reported by Ben)
- The sort box is no longer hidden behind the Email Job list. (reported by Johnathan H)
- The search function that was missing from the Email Report page is now back in place (reported by Kayla)
- On the main PM Site page, the Recently Published Projects list now shows the most recent publish date rather than the original publish date. (suggested by Ben)
- On the Sample Status – Dial Controls sub-tab, available sample to dial on was being displayed when nothing was selected for dial controls. This has been fixed (reported by Tanner)
- Also on Dial Controls, an issue was corrected where changes could not be saved. (reported by Jeanne)
- The Email Report was adjusted so that jobs with transmission dates for the year 1900 now show a status of “unknown”.
- The Email Job Scheduler was changed to default the Automation Script Name to “email hourly queue up” so that automation jobs will run correctly. (reported by Tanner)
- The AI Analytics for Text tool was fixed so that topic names are no longer garbled when the user zooms in and out on their browser screen.
February 1, 2024
Highlights
Restrictions on Joining Tables
Field Permissions
Permissions can now be set so that specific fields are only available to certain users in Dashboards, Crosstabs, and the Query Tool. Permissions can be set in the Configure Fields dialog:
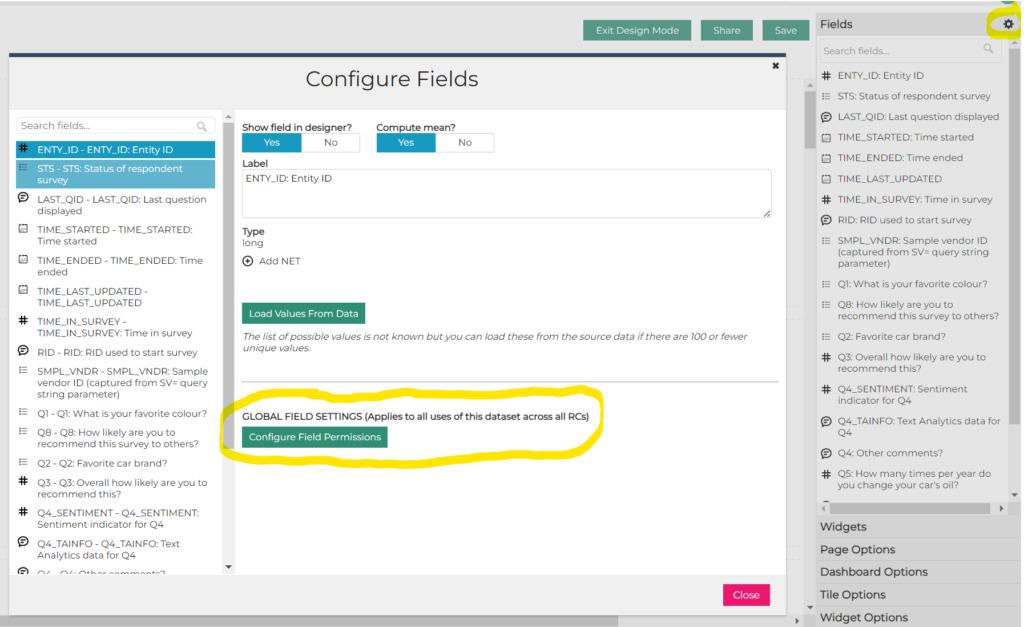
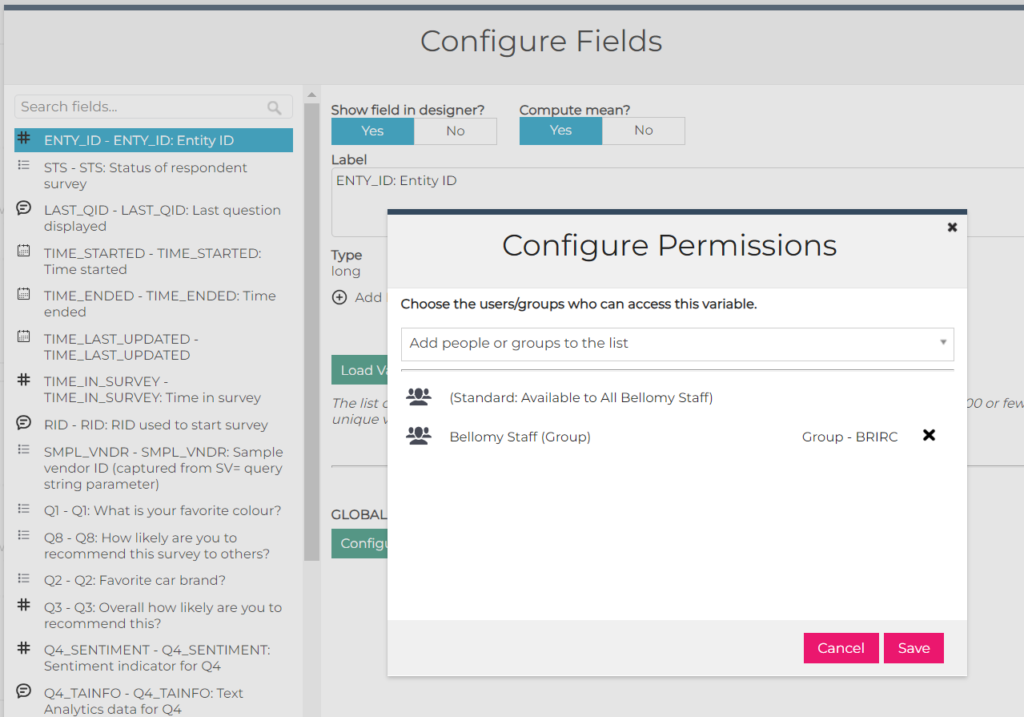
Please note that this is an initial, basic implementation of this capability and there will be future improvements. For now, the purpose is to be able to hide fields in the Fields list (or Rows/Columns in Crosstabs). It won’t hide fields that are added to the content of a Crosstab, Dashboard, or Query Tool. For example, if there is a Dashboard that has a widget that shows data from the SMPL_VNDR field, and permissions are set so that SMPL_VNDR is only available to Bellomy Users, that SMPL_VNDR widget and data will still be visible to client users. For now, permissions only determine what is available in the Fields list (Dashboards or Query Tools) or Rows/Columns (Crosstabs).
Restrictions on Joining Tables
In Crosstabs, Query Tool, and Dashboards, the ability to include fields from another survey has been enhanced to restrict the joins to survey for the same client.
When performing a join, you can use the Test button to confirm the new fields can be included for use:
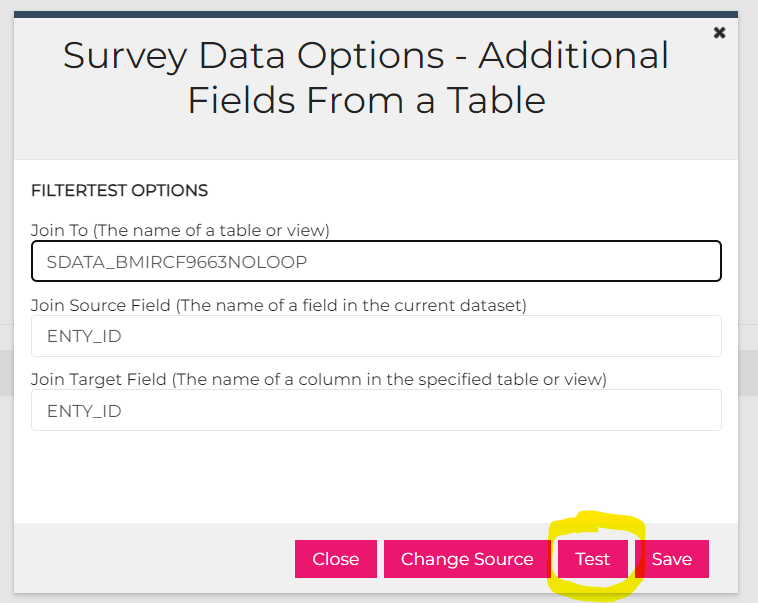
If you have encountering difficulty joining to another survey please check the Client field under the PM Site – Administration area to confirm it is set properly.
Note: Bellomy users can choose to override this restriction – a message will pop up where they will be asked to confirm they want to do the join and add the table to a white list so that it can be used for this and future joins.
AI Workflows enhancements
- Data that is attached to an AI chat will continue to be used by the chat session until it is explicitly removed.
- A scrollbar issue on the Data Collection screen was fixed.
- A scrollbar was added to the right side of the Data Collection tile.
- Results on Verbatim Cleanup can now be scrolled.
- Lagginess was reduced on input fields on the Qualitative Analyzer.
Resolved Issues
- When Configure Data Source is used for a Crosstab, Dashboard, or Query Tool to join to another table (for example, joining a survey to a panel screener survey), there was a bug where only the question numbers were displayed. This has been fixed so that the joined field names are now displayed. (reported by Lindsey)
- A bug was fixed on the PM Site Email Report where the grey bar the at top that contained filtering options was not being displayed. (reported by Kat)
- Another Email Report bug was also fixed so that the Trends tab is now displayed properly.
January 25, 2024
Highlights
Copying Dashboards, Crosstabs, Queries from the PM Site to client RCs
Copying Dashboards, Crosstabs, Queries from the PM Site to client RCs
Dashboards, Crosstabs, and Queries that were created in the PM Site can be copied to the corresponding client Research Cloud. To do this, use the gear icon next to the item to copy and select the “Copy to Client RC…” option.
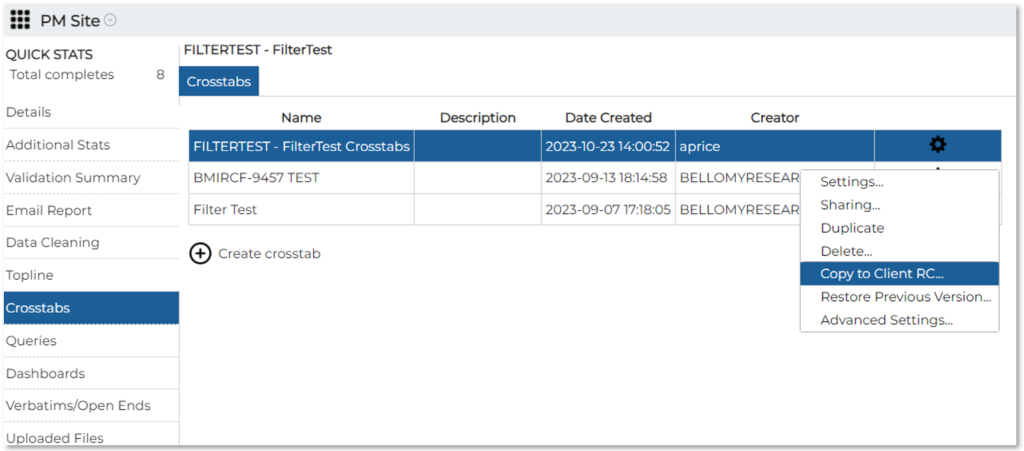
PM Site moved to BellomyRC
The PM Site has been moved to BellomyRC.BellomyOnline.com. It is still accessible via the link on the old PM Site.
Resolved Issues
Means are now displayed properly on dashboards when weighting is applied. Please note that Kat originally reported this issue.
An issue with line feeds in the AI Workflows SWOT Analyzer was fixed so that multiple <BR> tags are no longer appearing above the grid.
.
January 11, 2024
AI Insights for Text Enhancements
Emerging topics
Configure stories on trending
AI Comparison tool
Trending scores – allow user to configure metric
Trending scores – widen the topic labels
Issue resolved with 4 of 3 phases in AI Assistant
October 2023
Highlights
Easier way to edit Custom and Summary tables
Nets for Multiple Choice Questions
Alternative text for loops that use images
Improved UI for selecting RC team members
AI Analytics for Text Recommendations
Easier way to edit Custom and Summary tables
Custom and Summary tables in Crosstabs can now be edited directly from the Data Variables for Rows list without having to move them back over to the Available Data Variables list. This makes it easier to tweak them and to see the Results immediately.
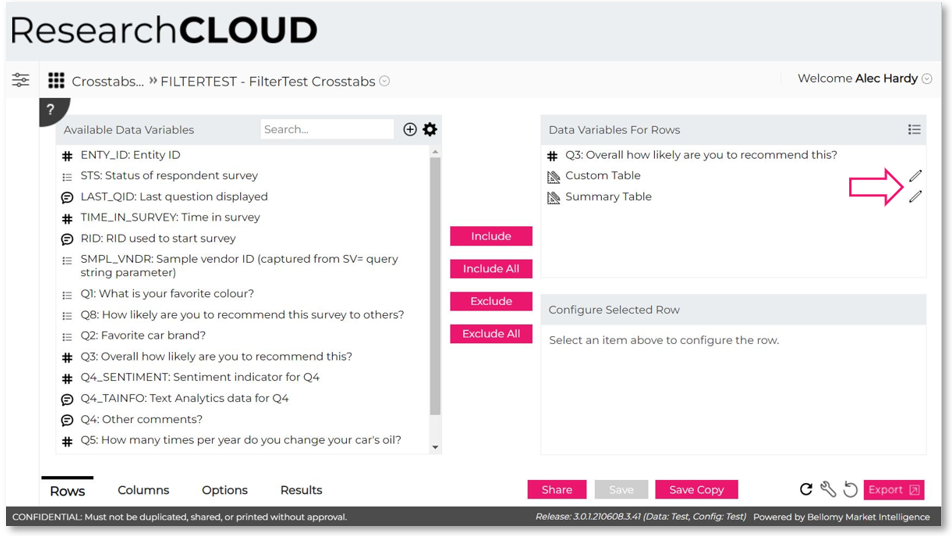
Nets for Multiple Choice Questions
Crosstabs custom nets can now be created for multiple choice questions! You can do this the same way as other nets – add a Net for a question and select the stubs to include.
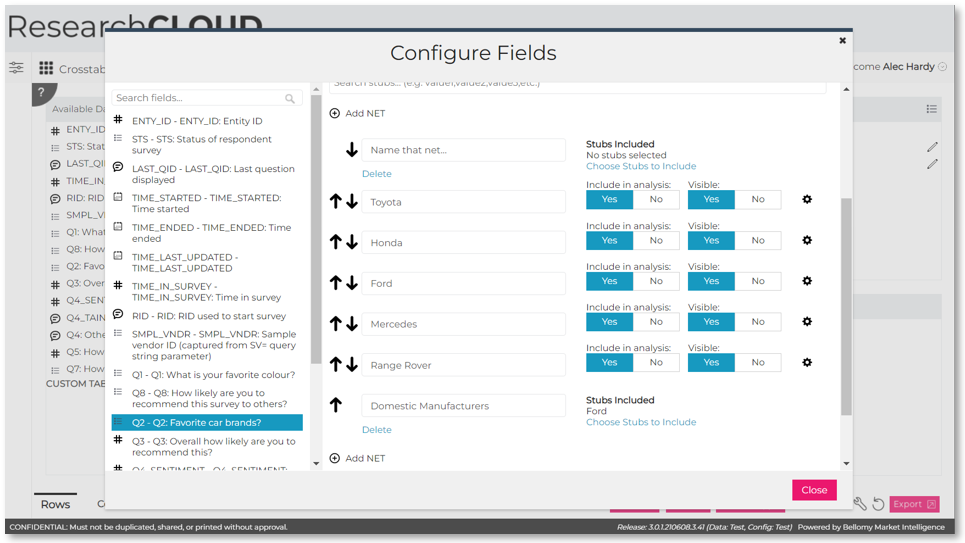
Adding Nets to Top of List
Custom nets in Crosstabs can be added to the top of the list of nets. Just use the button at the top of the list and the new net will appear at the top.
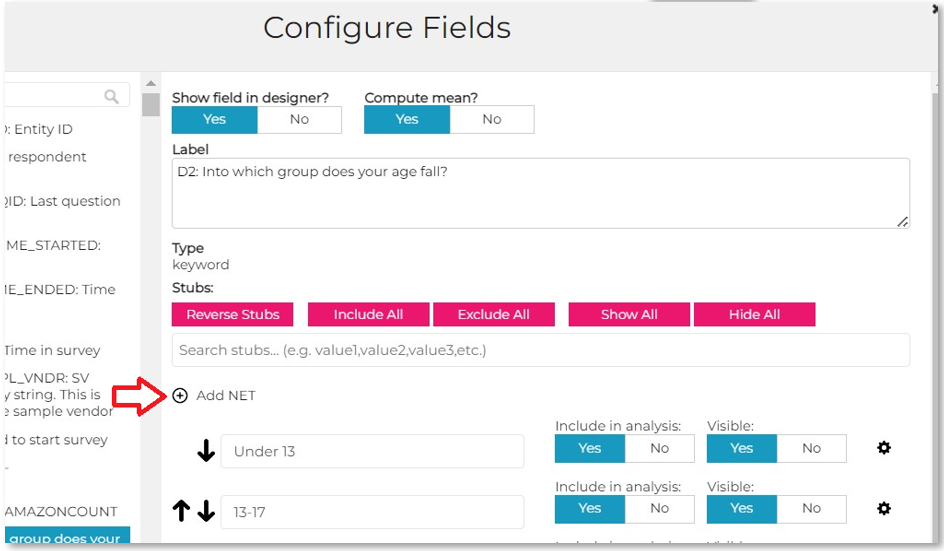
Alternative Text for Loops that Use Images
For loops that use images, such as concept tests, the loops can now be given text labels to make it easier to pick the correct loop in Crosstabs, Query Tools, and Dashboards. To do this, set the DISPLAY_LABEL property in the Survey Designer to the corresponding text to show for each loop iteration.
Improved UI for Selecting RC Team Members
The UI for adding team members to a client RC has been improved so that you can search for a see pictures of team members to be added.
AI Analytics for Text Recommendations
An exciting new feature has been added to the AI Analytics for Text tool! The tool can now make business recommendations based on open-ended data. Under Terms to Analyze, pick the “Recommendations (Bellomy Only)” option and the recommendations are displayed below. As the name implies, this is currently only for Bellomy users, and it only works for datasets loaded after September 23, 2023.
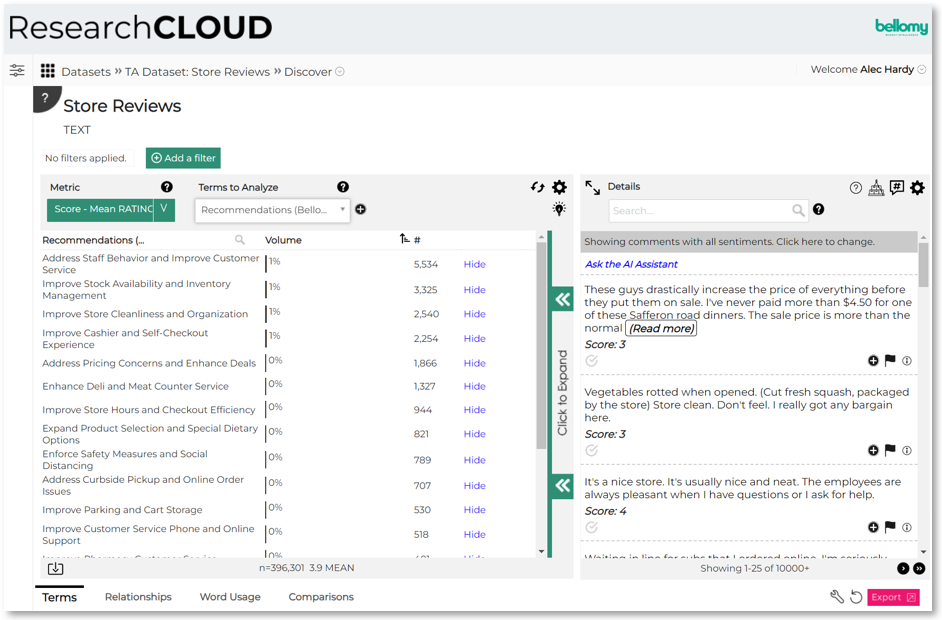
New AI Assistant workflows
Several new types of workflows have been added to the AI Assistant:
Bulk Text Analyzer
Qual Transcript Analyzer
Comparative Text Analyzer
Simple Chat
Professional Assistant
VBScript Helper
SWOT Tool
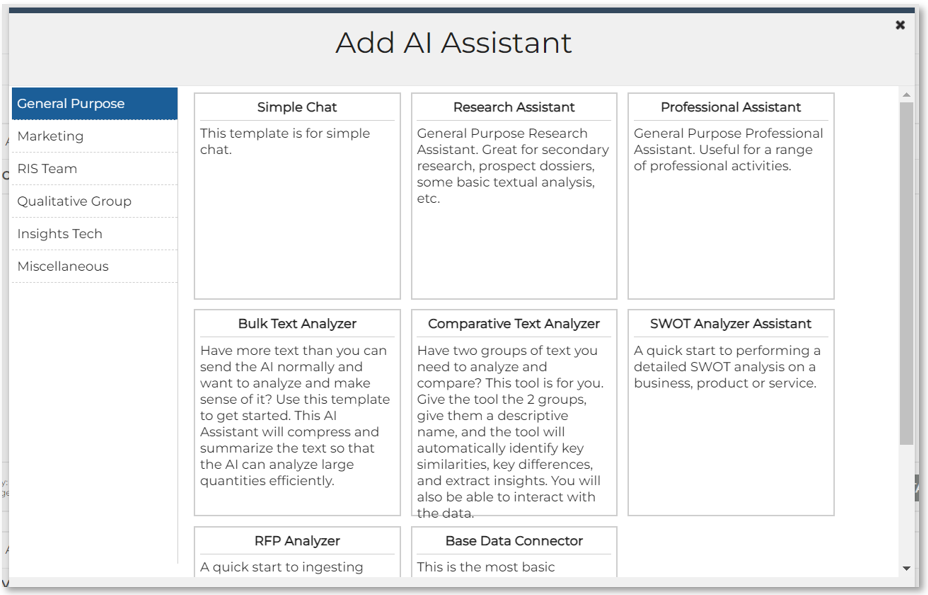
TA Autoloader for Qualtrics
Text Analytics data can now be loaded directly from Qualtrics. In the Text Analytics tool’s Datasets area, use the Load New Dataset button and select the Import Qualtrics Survey Data option.
Resolved Issues
Means and medians in Crosstabs results are now exported for all applicable question types.
All the text for a tile’s caption on a dashboard is now exported. Previously, only part of the tile caption was being exported. Note that if the caption is reeeaaaaally long, it will be cut off.
For bar charts exported from a dashboard, the number of decimal places in PowerPoint now match the number of decimal places in the Dashboard.
In the Query Tool Record Editor, Quota Frames can now be changed when there are many of them. Before this was fixed, it only showed a limited number of frames.
Stubs that were de-selected via the column header in a Query were still appearing in exports. That has been fixed.
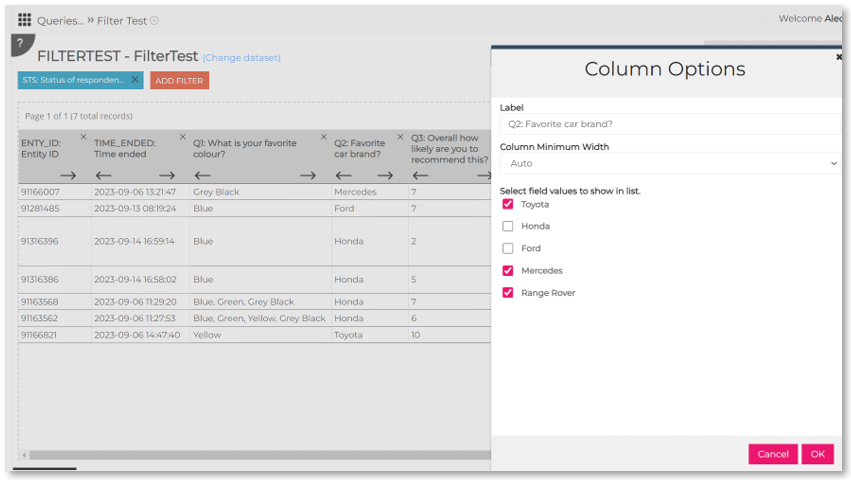
Frequencies and proportions are now displayed in Crosstabs for numeric entry field types.
On the new PM Site, the following issues were fixed:
- Errors that were appearing when adding a filter to the Detailed Stats page.
- Missing dialing summary information now appears on the Detailed Stats page.
- The Average Time in Each Question on the Detailed Stats page was fixed to display the correct value.
- Email settings are now defaulted to “include only seeds”.
- The contents of web pages doesn’t overlap the left navigation items any more.
- The total column is now shown on the Quotas tab for quotas that are set up to show those.
- Issues with downloading Excel of CSV data files for resources were fixed.
Questions? Problems? Suggestions?
techfeedback@bellomy.com is here to help. Drop us a line.